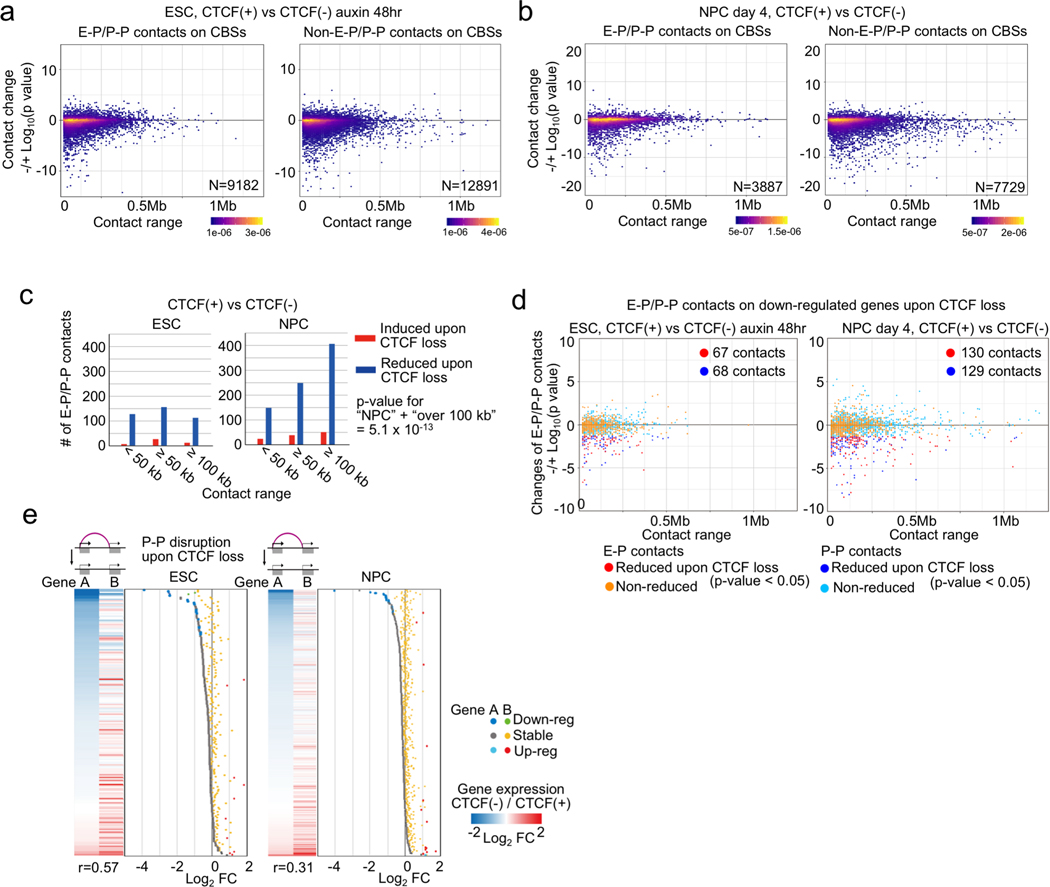
Extended Data Fig. 5. Changes of chromatin contacts upon acute CTCF loss illuminate relationship between CTCF-dependent P-P contacts and gene regulation.
a, b, Scatter plots showing changes of H3K4me3 PLAC-seq contacts (y-axis) on convergently oriented CBSs and their loop ranges (x-axis). Chromatin contacts in CTCF-depleted cells were compared to the chromatin contacts in control cells in ESC (a) and NPC stage (day 4) (b). The plots were classified based on whether they are on promoters and enhancers (E-P and P-P) (left) or not (right).
c, Histograms showing the number of significantly changed E-P(P-P) contacts upon CTCF loss and their genomic distances in ESC (left) and NPC (right) stages. Significantly induced and reduced contacts are shown as red and blue bars, respectively. P value: Pearson’s Chi-squared test for the comparison of the number of chromatin contacts that were long-range (≥ 100 kb) or not between the ESCs and NPCs.
d, Scatter plots showing changes of E-P(P-P) contacts anchored on CTCF-dependent down-regulated genes in ESC (left) and NPC stage (right). Chromatin contacts were classified based on whether they were E-P or P-P contacts (red vs blue dots). Their genomic ranges are plotted in x-axis. The number of reduced E-P and P-P contacts are also shown, respectively (p value < 0.05).
e, Heatmaps and dotplots showing gene expression changes (fold change, FC) of genes that lost P-P contacts upon CTCF loss in ESC (left) and NPC (right) stages. Each gene pair interacting through CTCF-dependent P-P contacts is shown as either Gene A or Gene B. Gene A have a lower log2-FC than Gene B. Pearson Correlation coefficients (r) between the gene expression changes of the two paired genes are shown on the bottom of the heatmaps. Blue and green dots; down-regulated gene A and B (FDR < 0.05), gray and yellow dots; stably regulated gene A and B, light blue and red dots; up-regulated gene A and B (FDR < 0.05).

