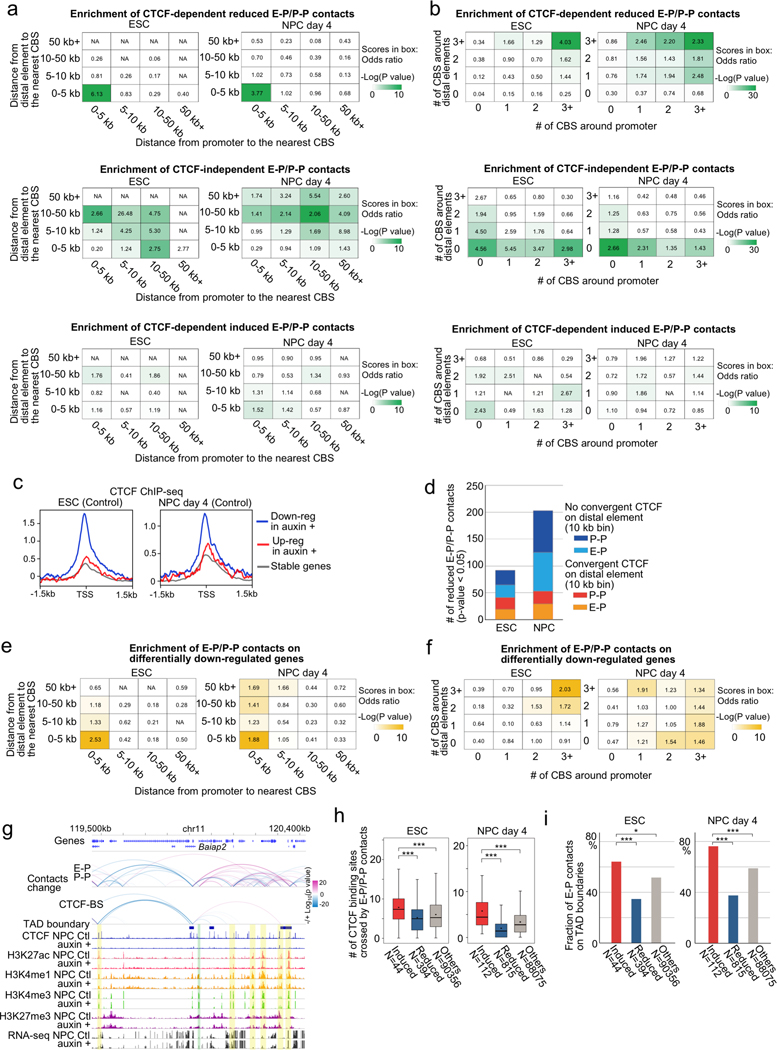
Extended Data Fig. 7. Features of CTCF-dependent/-independent E-P and P-P contacts.
a, b, Enrichment analysis of CTCF-dependent reduced E-P and P-P contacts (top), CTCF-independent E-P and P-P contacts (middle), and CTCF-dependent induced E-P and P-P contacts (bottom). Chromatin contacts were categorized based on the distance from the loop anchor sites on the distal element side (vertical columns) or promoter side (horizontal columns) to the nearest CBS (a) or based on the number of CBSs around loop anchor sites (10 kb bin ±5kb) on the distal element side (vertical columns) or promoter side (horizontal columns) (b). Enrichment values are shown by odds ratio (scores in boxes) and p-values (color) in ESCs (left) and NPCs (right) (see Methods).
c, Average enrichment of CTCF ChIP-seq signals on TSSs of CTCF-dependent up-regulated (red) or down-regulated (blue) and CTCF-independent genes (gray) in ESCs (left) and NPCs (right).
d, Histograms showing the number of reduced CTCF-dependent E-P and P-P contacts (p value < 0.05) anchored on CTCF-dependent down-regulated gene promoters with CBSs (TSS ± 5 kb) in ESCs (left) and NPCs (right). Chromatin contacts were classified based on whether their interacting distal elements were anchored on convergent CTCF or not (within 10 kb bin).
e, f, Enrichment analysis of E-P and P-P contacts anchored on CTCF-dependent down-regulated genes categorized based on the distance from the loop anchor sites on the distal element side (vertical columns) or promoter side (horizontal columns) to the nearest CBS (e). The same enrichment analysis categorized based on the number of CBSs around loop anchor sites (10 kb bin ±5kb) on distal element side (vertical columns) or promoter side (horizontal columns) (f). Enrichment values shown by odds ratio (scores in boxes) and p-values (color) in ESCs (left) and NPCs (right) (see Methods).
g, Genome browser snapshots of the Baiap2 locus. Arcs show changes of chromatin contacts on E-P and on CBSs. The colors of arcs represent change from control cells to CTCF-depleted cells (blue to red, −/+log10(p-value)). Promoter regions of Baiap2 and interacting enhancer regions are shown in green and yellow shadows, respectively. CTCF, H3K4me1, H3K27ac, H3K4me3, H3K27me3 ChIP-seq, and RNA-seq in control and CTCF-depleted NPCs, and TAD boundaries in control cells are also shown.
h, Boxplots showing the number of CBSs located between two anchor sites of significantly induced (red) or reduced (blue) E-P contacts upon CTCF loss, and CTCF-independent E-P contacts (gray). The numbers of data points are indicated on the bottom. *** p value < 0.001, two-tailed t-test.
i, The fraction of E-P and P-P contacts that overlapped with TAD boundaries in ESCs (left) and NPCs (left). The numbers of data points are indicated on the bottom. * p value < 0.05, *** p value < 0.001, Pearson’s Chi-squared test.

