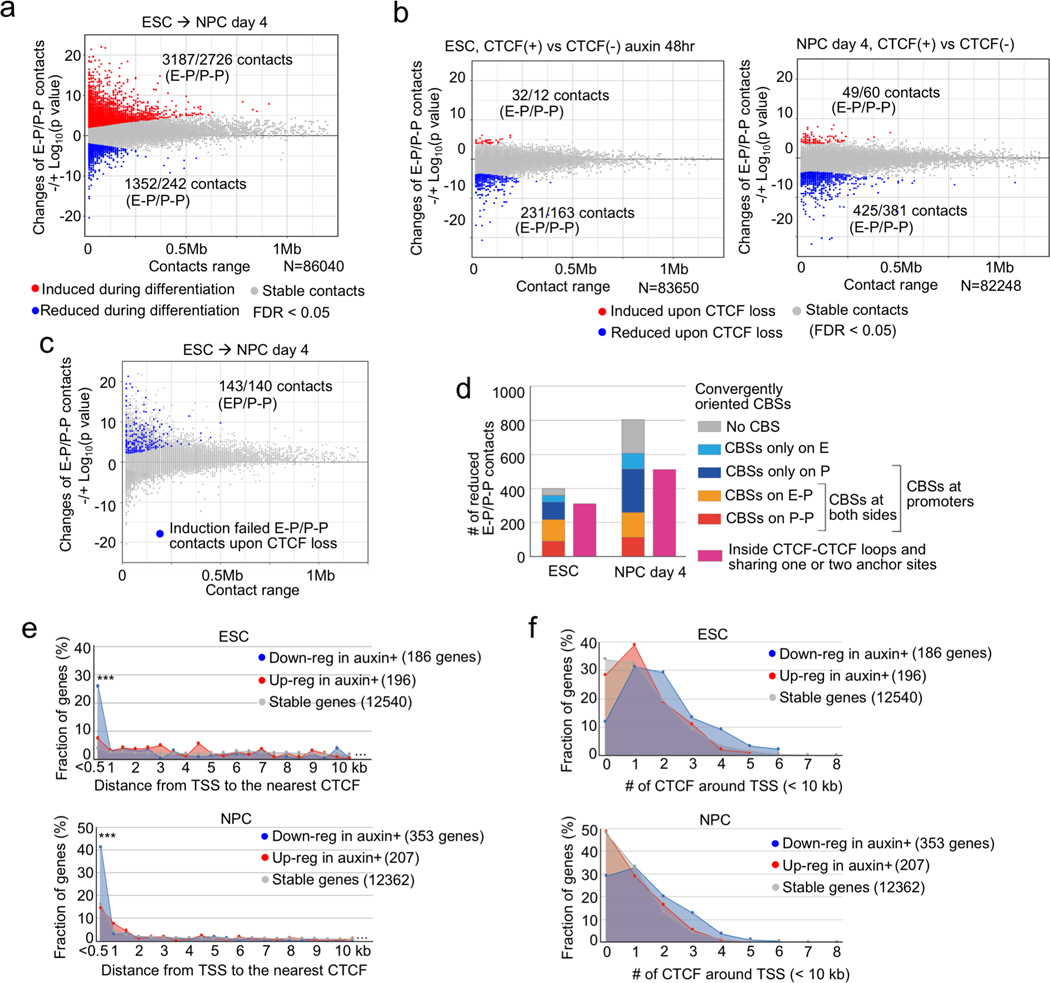
Fig. 2 |. CTCF loss reduces promoter-anchored contacts at a modest number of genes.
a, b, Scatter plots showing genome-wide changes of chromatin contacts anchored on promoters and enhancers (y-axis) identified in differential interaction analysis between ESCs and NPCs (a) and between control and CTCF-depleted cells in ESC (b, left) and NPC stage (day 4) (b, right). Genomic distances between their two loop anchor sites are plotted in x-axis. Significantly induced and reduced chromatin contacts are shown as red and blue dots, respectively (FDR < 0.05). The interaction changes are shown by significance value (−/+log10(p-value)) (Fisher’s exact test, n=2 independent experiments). The numbers of significantly changed E-P and P-P contacts are indicated.
c, E-P and P-P contacts that were significantly induced during neural differentiation but significantly reduced upon CTCF loss were plotted as blue dots on the scatter plots displayed in (a). The numbers of significantly changed E-P and P-P contacts are indicated.
d, Histogram showing the numbers of significantly reduced E-P and P-P contacts upon CTCF loss that were categorized based on whether their anchor sites (10-kb bin) on promoter and enhancer regions have convergently oriented CTCF binding sites (CBSs) or not. Purple bars show the number of E-P and P-P contacts that were located inside CTCF-CTCF loops and whose anchor sites overlapped with at least one anchor site of CTCF-CTCF loops.
e, f, Fraction of genes classified based on genomic distance from TSS to the nearest CTCF ChIP-seq peak (e), and fraction of genes classified based on the number of CTCF ChIP-seq peaks around TSS (< 10 kb) (f) are shown. CTCF-depletion induced down-regulated genes (blue), up-regulated genes (red), and CTCF-independent genes (gray) in ESCs (top) and NPCs (bottom) are shown. *** p value < 0.001, Pearson’s Chi-squared test for the comparison of the number of genes that had CTCF at TSS (< 500 bp) or not between down-regulated genes and the other types of genes.

