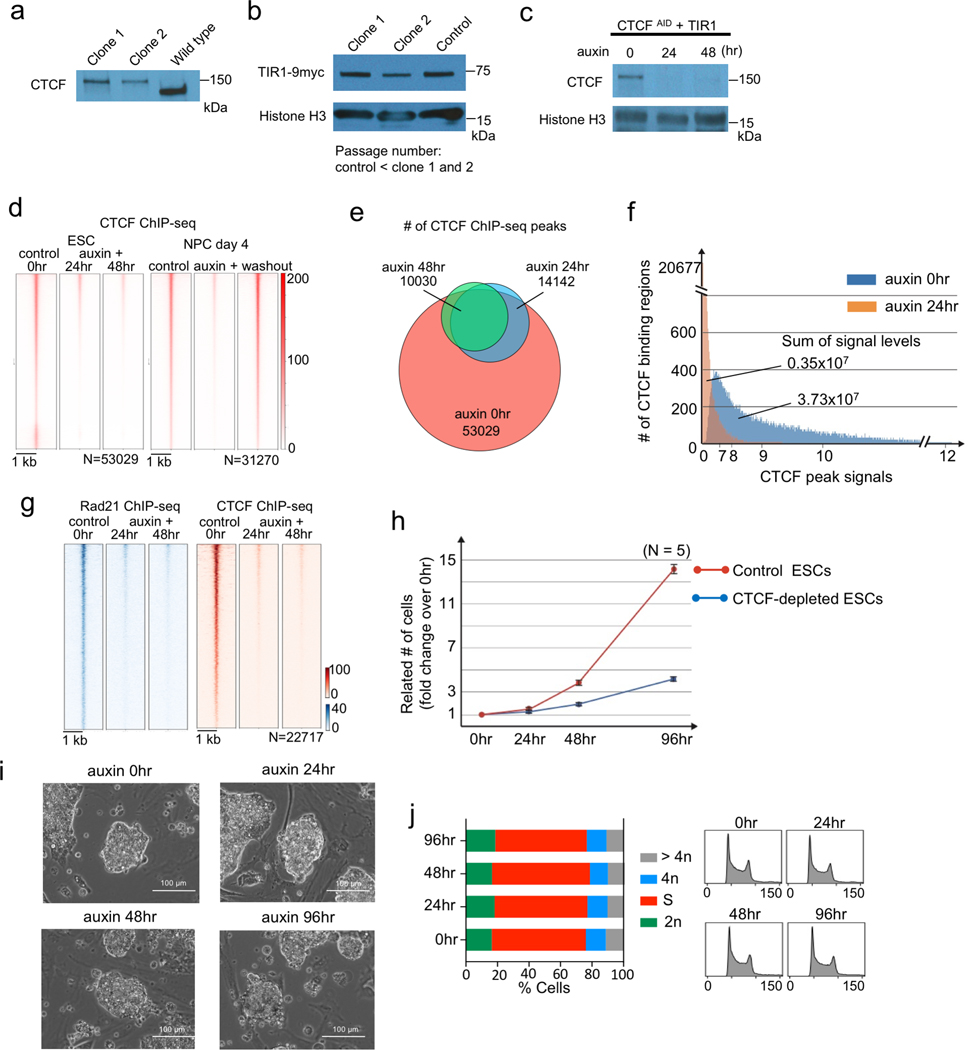
Extended Data Fig. 1. Depletion of CTCF and characterization of CTCF-depleted cells.
a, b, Western blot showing AID-tagged CTCF and wild type CTCF (a) and the expression of TIR1 protein in two mESC clones. TIR1 expression in these clones that went through multiple passages was comparable to that in control cells with lower passage number. Uncropped images are available as source data online.
c, Western blot showing acute depletion of CTCF protein after 24 and 48 hours of auxin treatment. Uncropped images are available as source data online.
d, Heatmaps showing CTCF ChIP-seq signals centered at all regions of CTCF peaks identified in the control cells and CTCF occupancy at the same regions in CTCF-depleted cells at each time point of differentiation.
e, Venn-diagram comparing the number of CTCF ChIP-seq peaks identified in control and CTCF-depleted ESCs at each time point.
f, Histogram showing the number of CTCF binding regions in y-axis and the associated CTCF ChIP-seq signal level in x-axis. The CTCF signal levels in control cells and auxin treated cells were calculated for CTCF peak regions identified in the control cells.
g, Heatmaps comparing Rad21 ChIP-seq signals centered at all regions of Rad21 peaks identified in control and CTCF-depleted ESCs at each time point (left, blue heat map). CTCF occupancy are also shown (right, red heat map).
h, Growth curves of mouse ESCs with or without auxin treatment. Date are plotted as averages +/− standard deviation (n=5 independent experiments).
I, Bright-field microscopy images of mouse ESC colonies before and after auxin treatment.
j, Cell cycle analysis by flow cytometry using propidium iodide staining in control ESCs and after 24, 48, and 96 hours of auxin treatment.

