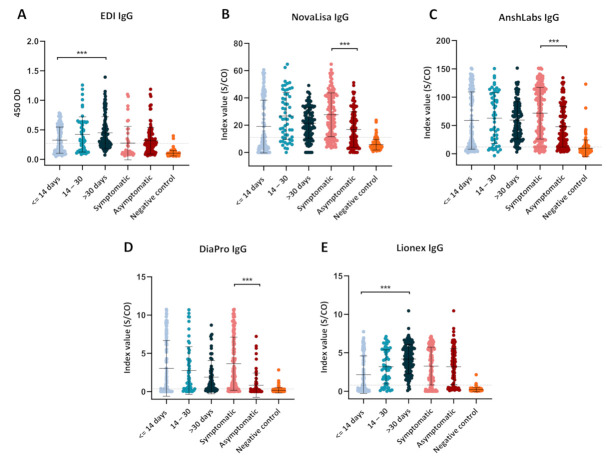
Figure 6.
Dot plot distribution of the IgG ELISA index values according to the different time points of sampling (≤14, 14–30, >30 days) and coronavirus disease 2019 (COVID-19) patient classification (symptomatic or asymptomatic). Each dot plot represents the index values obtained with each serological assay: (A) EDI™, (B) NovaLisa, (C) AnshLabs, (D) DiaPro, and (E) Lionex. Results are expressed as a ratio of the sample signal to the cutoff for all tests except the EDI™ assay, which is expressed in optical density. One-way analysis of variance (ANOVA) was used to compare the differences between groups, *** p < 0.001.

