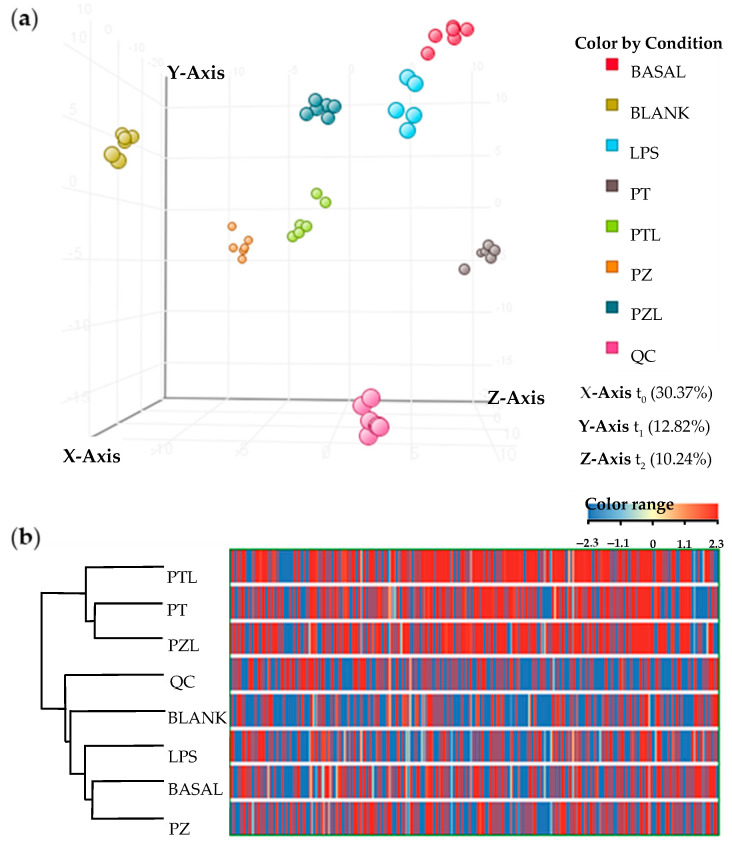
Figure 1.
Multivariate statistical analysis of the subsequent evaluated conditions: Basal; LPS, lipopolysaccharide; PZ, phlorizin; PT, phloretin; PZL, phlorizin + LPS; PTL, phloretin + LPS; Blank and QC, quality control. (a) PLS-DA score plot (accuracy of the model of 91.254%, R2 = 0.567 and Q2 = 0.167); (b) Hierarchical clustering analysis by applying Pearson’s centered absolute similarity measure and complete linkage.

