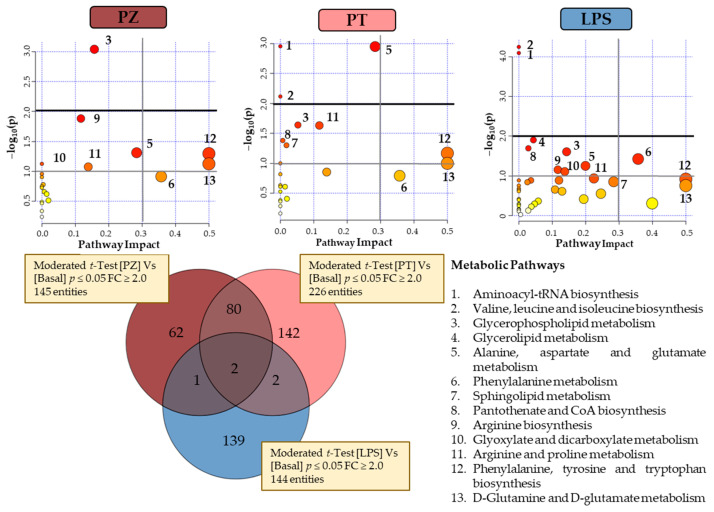
Figure 3.
Venn diagram and metabolome overviews obtained from MetaboAnalyst pathway analysis of the subsequent evaluated conditions: PZ, phlorizin; PT, phloretin; and LPS, Lipopolysaccharide compared to BASAL. The top-pathways are ranked by the gamma-adjusted p values for permutation per pathway (y-axis) and the total number of hits per pathway (x-axis). The colour graduated from white to yellow, orange and red, circle size (large > small) as well as the values of both x and y increase represents the degree of significance.

