Figure 1.
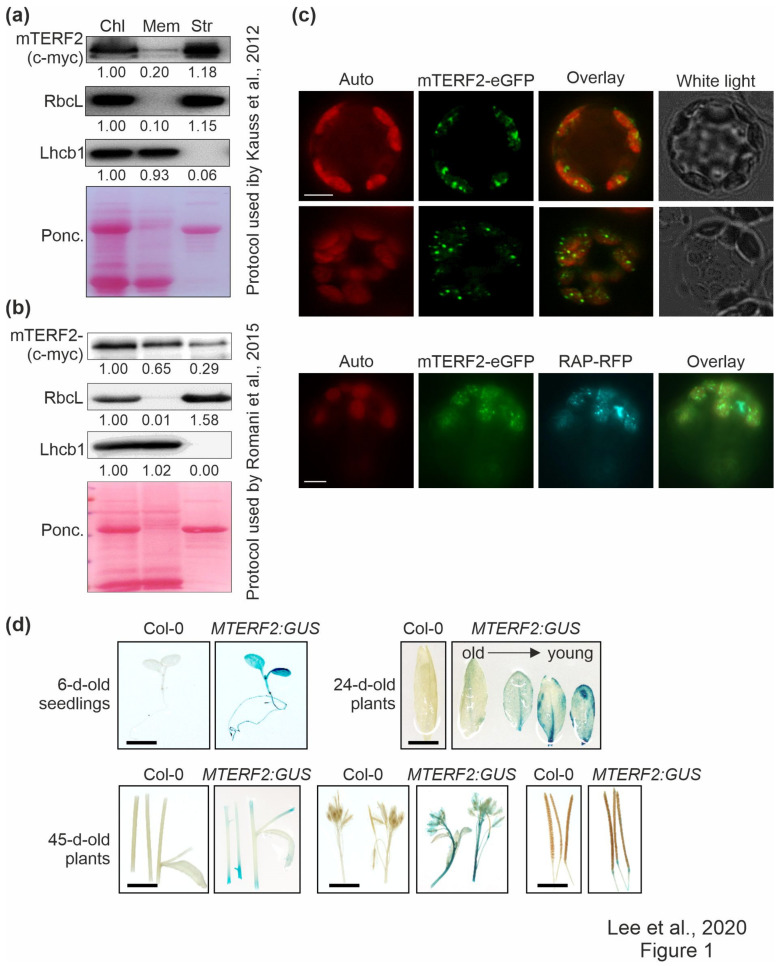
Localization and tissue-specific expression analysis of mTERF2. (a) and (b) Chloroplasts (Chl) were isolated from 3-week-old Col-0 plants overexpressing mTERF2-c-myc and fractionated into membrane (Mem) and stroma (Str) components according to (a) the protocol used by Kauss et al. [37], or (b) the protocol used by Romani et al. [20]. The fractions were subjected to SDS-PAGE, transferred to a polyvinylidene difluoride membrane (PVDF), and exposed to antibodies raised against c-myc (to detect the mTERF2-c-myc fusion protein), RbcL (as a control for the stromal fraction), or light-harvesting Chl a/b-binding protein 1 (Lhcb1; as a control for the thylakoid fraction). Quantification of signals relative to the whole chloroplast fraction (=1.00) is provided below each blotted lane. Ponc., Ponceau Red. (c) Transient expression of mTERF2 fused to enhanced green fluorescent protein (mTERF2–eGFP) was observed in A. thaliana protoplasts with fluorescence microscopy. To visualize chloroplast nucleoids, protoplasts were (co)-transformed with RAP fused to red fluorescent protein (RAP-RFP; as a marker for chloroplast nucleoids). The eGFP fluorescence is shown in green (eGFP), RFP fluorescence in cyan (RFP), autofluorescence of chloroplasts in red (Auto). Scale bars = 10 μm. (d) Tissue-specific expression patterns of mTERF2 were visualized with GUS activity staining in 6-day-old seedlings, leaves of 24-day-old plants, and stems, flowers, and siliques of 45-day-old plants, respectively. MTERF2:GUS, Col-0 plants harboring the MTERF2 promoter fused to GUS. Bars = 1 cm.

