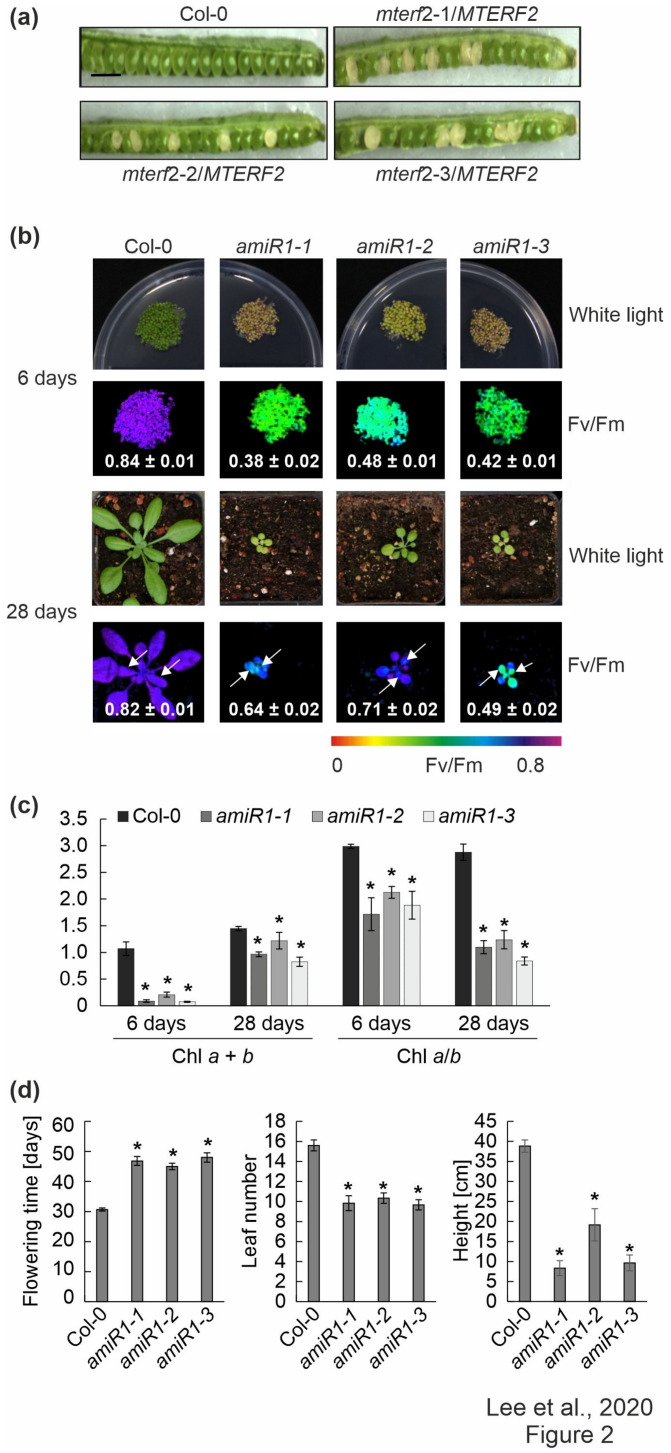
Figure 2.
Phenotypic analysis of mterf2 T-DNA insertion mutants and artificial microRNA (amiRNA1)-mediated mterf2 knock-down mutants. (a) Seed development of mterf2 T-DNA insertion mutants was investigated in 40-day-old wild-type (Col-0) and heterozygous mutants (mterf2/mTERF2). In siliques of mterf2-1/mTERF2, mterf2-2/mTERF2, and mterf2-3/mTERF2 plants, white ovules are found interspersed with normal green ovules. White ovules in siliques indicate aborted seeds and they account for approximately 25% of the total (44 of 143 for mterf2-1/mTERF2, 21 of 106 for mterf2-2/mTERF2, and 25 of 97 for mterf2-3/mTERF2 of all the ovules analyzed). Bar = 1 cm. (b) Phenotypes of six-day- and 28-day-old wild-type (Col-0) and amiRNA1-generated mterf2 mutants (amiR1) grown under long-day (LD) conditions (16-h light/8-h dark) on half-strength MS (+1% sucrose) media or soil, respectively. The maximum quantum yield of PSII (Fv/Fm) in the plants was measured with an Imaging PAM device. The arrows indicate the leaves for which Fv/Fm values were measured. Average values ± SD (n ≥ 6) are provided. Scale bars = 1 cm. (c) Acetone-extracted chlorophyll was spectrophotometrically measured and total Chl (Chl a + b) concentration and the Chl a/b ratio were calculated, as described [34]. Average values ± SD (n ≥ 4) are provided. Significant differences (p < 0.05) between Col-0 and mutant lines were identified while using Student’s t-test, and they are denoted by asterisks (*). (d) mTERF2 plays a role in plant growth and development, as evidenced by the determination of flowering time, leaf number at bolting time, and the final height of the wild-type (Col-0) and amiR1 mutant plants. The values are represented as mean ± SD (n ≥ 6), and significant differences (p < 0.05) between Col-0 and mutant lines were identified by the Student’s t-test, and they are denoted by asterisks (*).

