Figure 6.
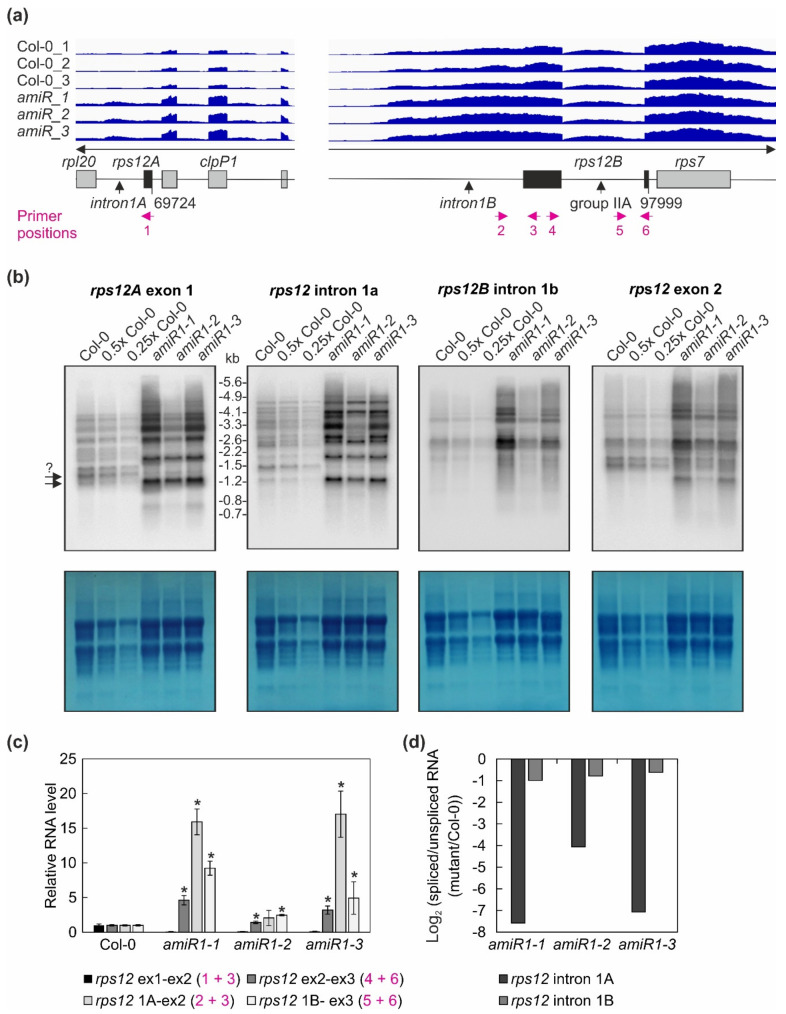
The expression and processing of chloroplast rps12 transcripts in wild-type (Col-0) and mterf2 mutant plants. (a) RNA-Seq analysis was performed with RNA extracted from wild-type (Col-0) and amiR1–3-mterf2 mutant (amiR) seedlings. The read depths of rps12A and rps12B transcripts detected in Col-0 and amiR seedlings were visualized with the Integrative Genomics Viewer (IGV). The schematic representations of the chloroplast rps12 genes below the IGV snapshots depict the rps12A and rps12B genes, which are approximately 28 kb apart in the chloroplast genome, and have to be trans-spliced. The rps12A gene containing exon 1 and intron 1A is cotranscribed with rpl20 and clpP1 transcripts and the rps12B gene containing intron 1B, exon 2, intron 2l and exon 3 is cotranscribed with ndhB and rps7. The magenta arrows indicate the primer positions used in panel (c). (b) The levels and splicing patterns of rps12 transcripts were analyzed in six-day-old wild-type (Col-0) and mterf2 mutant plants (amiR1-1, amiR1-2, amiR1-3). Total RNA was isolated, and aliquots resolved on a formaldehyde-containing denaturing gel were transferred onto a nylon membrane and probed with [α-32P]dCTP-labeled cDNA fragments specific for rps12 exon 1, intron 1A, intron 1B, and exon 2. rRNA was visualized by staining the membrane with Methylene Blue (M. B.) as a loading control. The arrows with the question mark indicate uncertainty about the size of the mature transcript. (c) Quantitative RT-PCR analysis of 6-day-old wild-type (Col-0), amiR1-1, amiR1–2 and amiR1-3 mutant seedlings. PCR was conducted with primer pairs marked in panel (a) and AT4G36800, encoding an RUB1–conjugating enzyme (RCE1) as a control. The RNA expression levels are reported relative to that in the Col-0, which was set to 1. Bars indicate standard deviation (SD). Significant differences between mutants and Col-0 were evaluated with Student’s t-test (p < 0.05) and are denoted by the asterisks (*). (d) The ratios of spliced to unspliced rps12 transcripts in amiR1–1, amiR1-2, amiR1-3, and Col-0 were calculated based on the result shown in panel (c), and the data are displayed as log2 ratio of spliced to unspliced rps12 transcripts in the mutants compared to the wild-type (Col-0).

