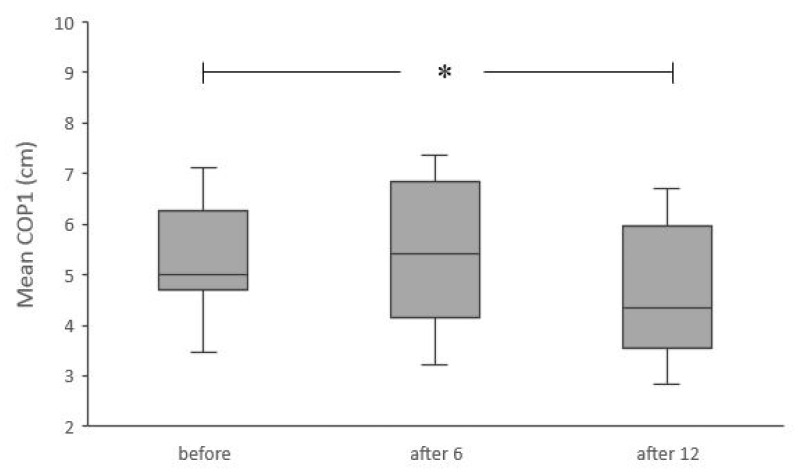
Figure 5.
Results for the mean COP position relative to the medial malleolus in the first phase of limit of stability test, before intervention and after six and 12 training sessions. * Significant differences (p < 0.05). Box plots indicate interquartile ranges (areas within a box), medians (horizontal line in the box), error bars indicate the range (min–max).

