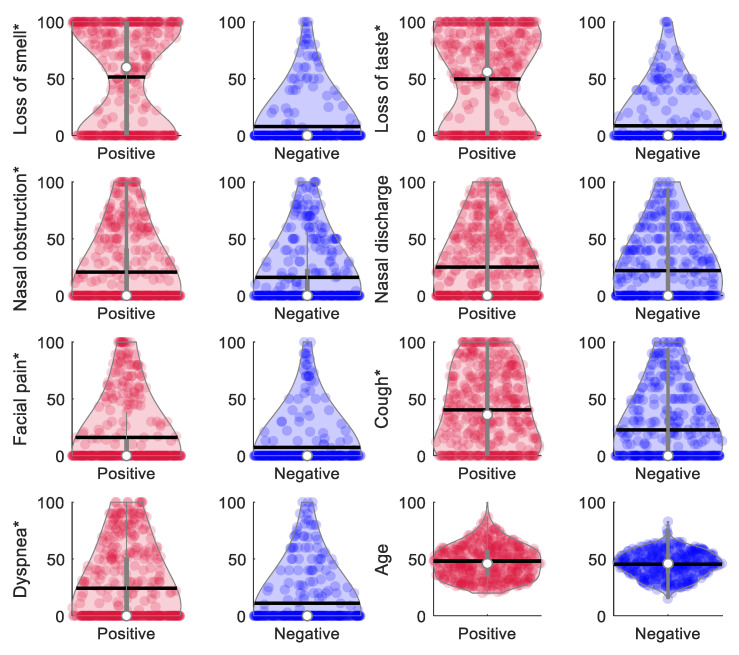
Figure 2.
Violin plots showing the distribution of self-reported VAS scores for symptom intensity. The white dots depict the median value and the vertical gray lines the interquartile range (25th and 75th quantiles). Horizontal black lines represent the mean value. Symptoms accompanied with an asterisk (*) showed significant differences in the Student’s t-test between positive and negative groups: loss of smell, loss of taste, facial pain, cough, dyspnea (p < 0.0001), and nasal obstruction (p = 0.0311). Nasal discharge (p = 0.1481) and age (p = 0.0628) were not significantly different between groups.

