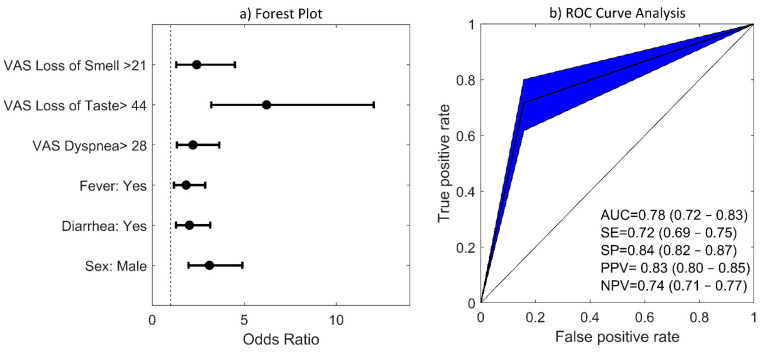
Figure 3.
Step-wise logistic regression model obtained under BIC criterion: (a) Forest plots for association between symptoms and COVID-19 diagnosis. Note that for this analysis, VAS numeric variables reporting the intensity of symptoms were dichotomized into two categories: being higher or lower than the corresponding VAS cutoff point. VAS cutoff points for each symptom were previously calculated using ROC analysis and are listed in Table 2. Error bars denote 95% CIs; (b) ROC curve for prediction of COVID-19 in the (25%) holdout testing dataset. AUC, SE, SP, PPV, and NPV mean values are shown together with their 95% CIs. The confidence region of the ROC curve is depicted in blue.

