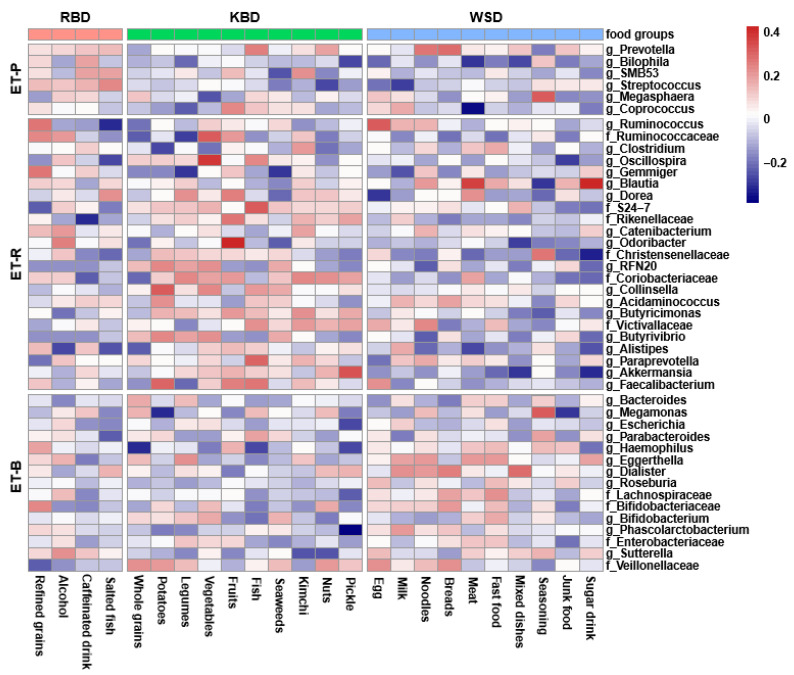
Figure 5.
Heatmaps of partial Spearman correlations between intakes of food groups in each dietary pattern and relative abundance of gut microbiota at the genus level. Food groups were gathered into each dietary pattern, and fecal bacteria were arranged into one enterotype when the bacteria contents were higher than the other enterotypes, and they were classified into ET-P, Prevotellaceae; ET-R, Ruminococcaceae; ET-B, Bacteroidaceae.

