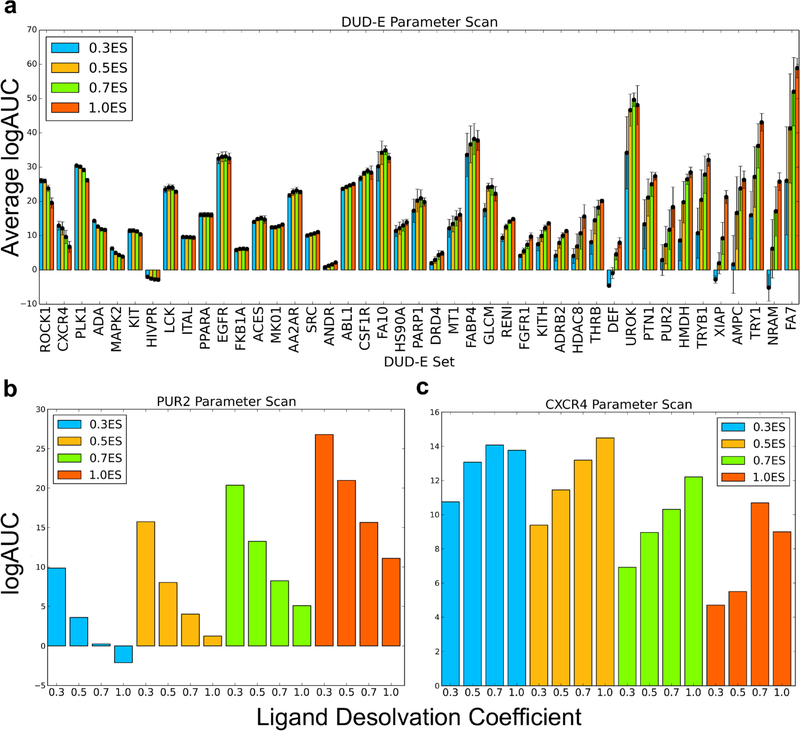
Figure 1.
(a) For each electrostatic coefficient (0.3, 0.5, 0.7, and 1.0), the average adjusted log AUC value and standard error, which are calculated over the four ligand desolvation coefficients (0.3, 0.5, 0.7, and 1.0), are plotted. Individual adjusted LogAUC plots for each electrostatic and ligand desolvation coefficient combination for PUR2 (b) and CXCR4 (c) are shown. Performance for PUR2 diminishes as the ligand desolvation coefficient increases, while performance for CXCR4 improves as the ligand desolvation coefficient increases.

