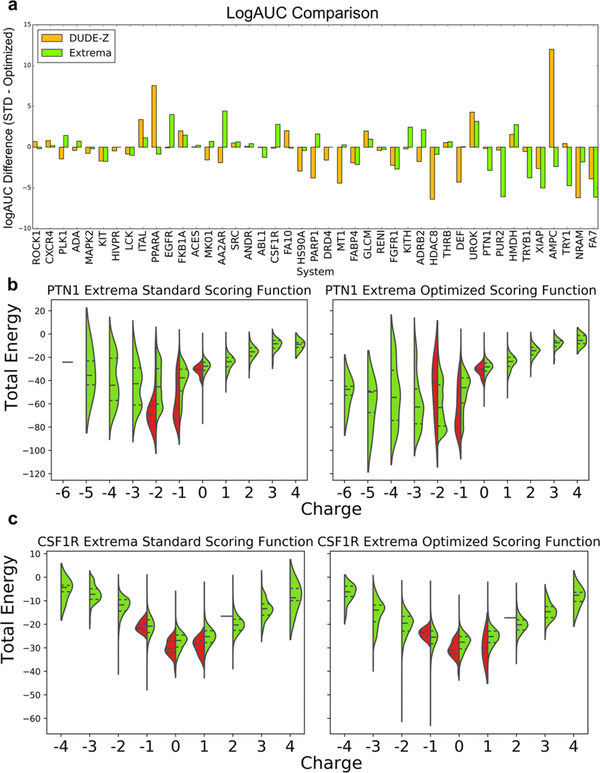
Figure 4.
(a) Adjusted LogAUC differences between the standard scoring function and the weighted scoring function using the new DUDE-Z decoy pipeline and the charge extrema decoys. (b,c) through (e). Comparing DOCK energy and molecule charge of the standard and optimized scoring functions using DUDE-Z ligands and using charge extrema decoys for (b) protein-tyrosine phosphatase 1 (PTN1) and (c) macrophage colony stimulating factor receptor (CSF1R). Central dotted lines of DOCK energies represent the medians, upper dotted lines represent the third quartiles, and lower dotted lines represent the first quartiles. The lowest points represent the minimum DOCK energies, and the highest values represent the maximum DOCK energies for both scoring functions. As ligand desolvation is down-weighted in the optimized scoring function, more extreme charges score better, which is advantageous for targets that have extreme charged ligands like PUR2 and PTN1. However, this becomes problematic and decreases enrichment for systems whose ligands are less extreme like EGFR and CSF1R.

