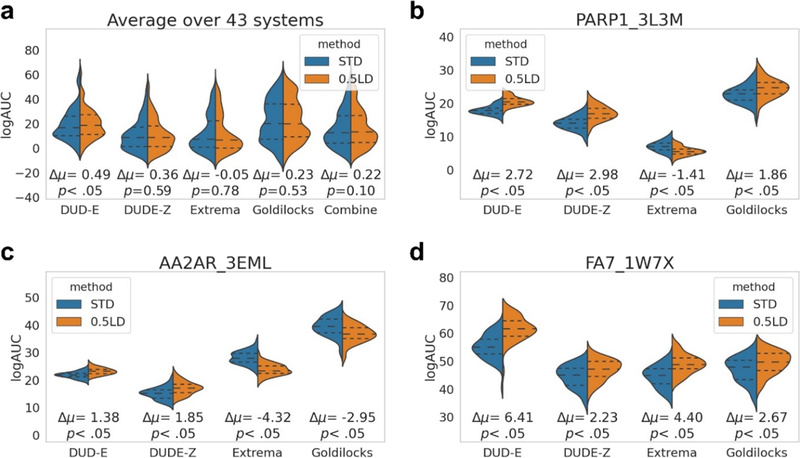
Figure 6.
Applying bootstrapping to the different decoy backgrounds demonstrates that while there may be statistically significant differences in terms of performance between the scoring functions for particular systems, if all bootstrapping enrichments are combined for all decoy sets over all 43 systems, then there is no statistically significant difference between the standard and optimized scoring functions, demonstrating that one can be deceived by significant differences between the two scoring functions when only considering one decoy background. Average bootstrapping statistics on the enrichments for DUD-E, DUDE-Z, Extrema, Goldilocks, and all decoy sets (Combined) for all 43 systems (a). Individual bootstrapping statistics (50 for each) on the enrichments (adjusted log AUC values) for DUD-E, DUDE-Z, Extrema, and Goldilocks decoy backgrounds for poly-ADP-ribose polymerase I (PARP1, b), adenosine 2A receptor (AA2AR, c), and coagulation factor VII (FA7, d). From the 50 bootstrapped adjusted log AUC values generated, central dotted lines represent the medians, upper dotted lines represent the third quartiles, and lower dotted lines represent the first quartiles. The lowest points represent the minimum adjusted log AUC values, and the highest points represent the maximum adjusted log AUC values generated from bootstrapping. See Figure S3 for difference distributions and Figure S4 for bootstrapping plots for all 43 systems.

