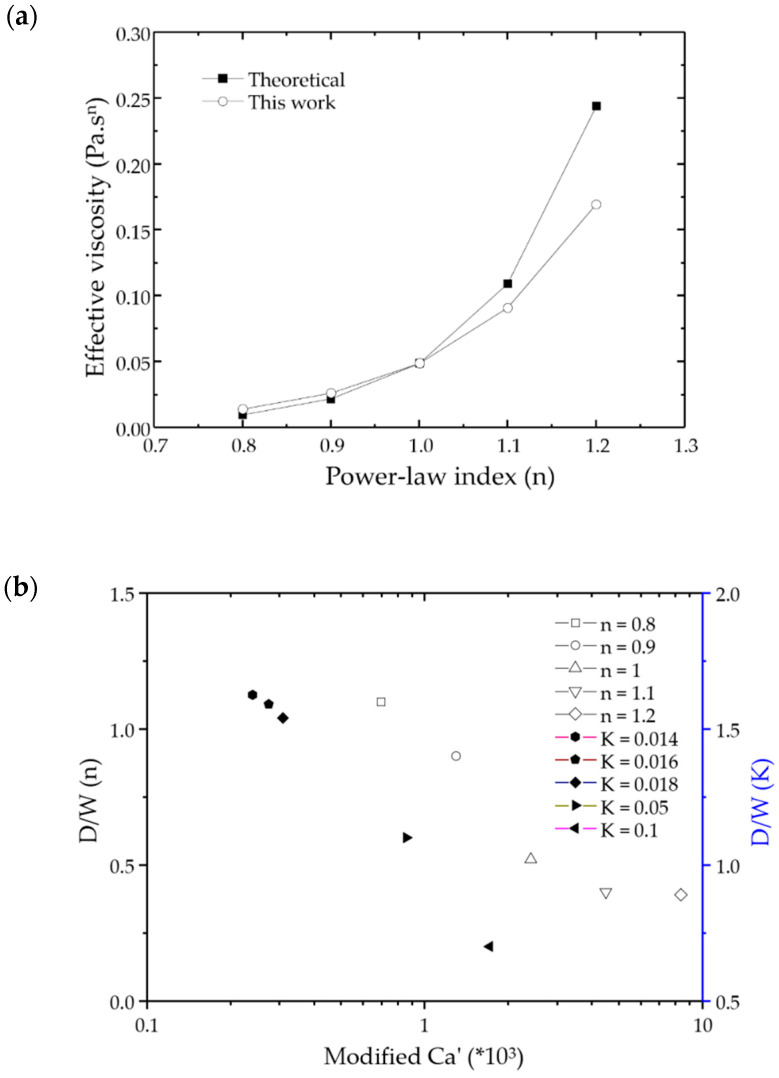
Figure 6.
(a) Comparison of the calculated result with our simulation result. The solid icons represent the experimental results, and the open ones are the simulation results; (b) The scaling relation for the non-dimensional droplet size with the modified Ca’ for various power-law liquids at different conditions. The solid icons represent the K results, and the open ones are the n results.

