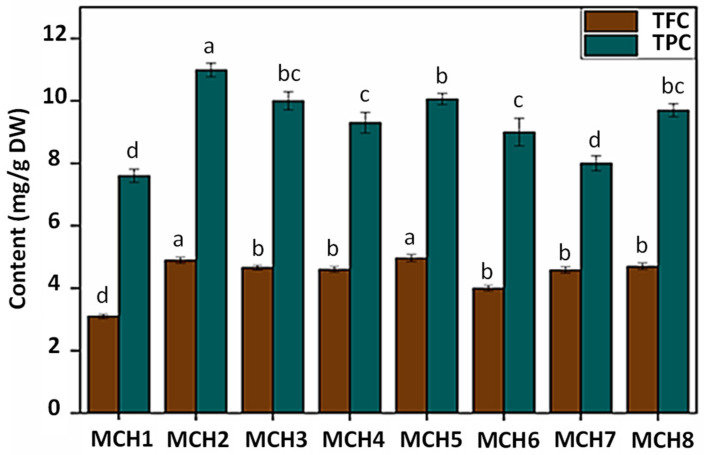
Figure 1.
Phenolic and flavonoid content of samples at different chitosan concentrations. MCH1: control; MCH2: 0.5 mg/L chitosan; MCH3: 1.0 mg/L chitosan; MCH4: 2.5 mg/L chitosan; MCH5: 5.0 mg/L chitosan; MCH6: 10.0 mg/L chitosan; MCH7: 25.0 mg/L chitosan; MCH8: 50.0 mg/L chitosan; Values are means ± SD of three independent replicates. Different letters represent significant differences between the various extraction conditions (p < 0.05).

