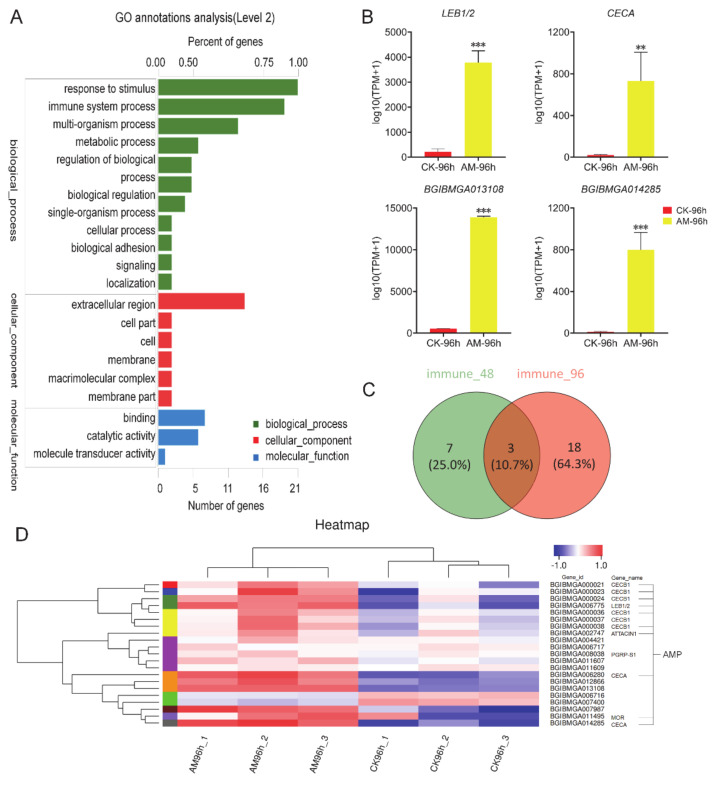
Figure 2.
Transcriptome analysis of immune-related genes. (A) GO annotations analysis at 96 h after modeling. ‘Number of genes’ and ‘Percentage of gene’ refer to the number of differentially expressed genes involved in biological processes and its proportion in the total number of differentially expressed genes, respectively. (B) The expression of immune-related genes changed significantly at 96 h after modeling. (C) Venn diagram, the number of immune-related genes that changed significantly at 48 and 96 h after modeling. (D) Heatmap, differences in expression of immune-related genes that significantly changed at 96 h after modeling. Most of the genes belong to AMP genes, and others have not been annotated. Each column in (D) represents a sample, and each row represents a gene. The color represents the normalized expression value of the gene in each sample. Red represents the higher expression level of the gene in the sample, and blue represents the lower expression level. The number label under the color bar on the upper right represents the specific expression level change trend. On the left is the tree diagram of gene clustering and the module diagram of sub-clusters, and on the right is the name of the gene. ** p < 0.01; *** p < 0.001. n = 3.

