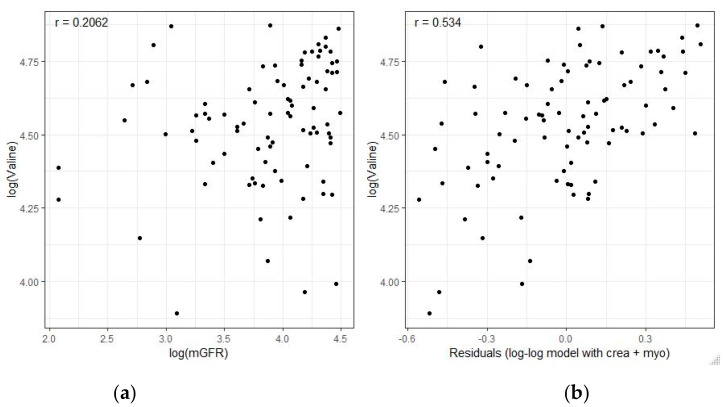
Figure 1.
Correlation of valine with measured GFR (mGFR). (a) Univariate scatterplot and Pearson correlation coefficient r between the logarithmic serum level of valine and logarithmic mGFR. (b) The differences between mGFR and the predicted GFR values by the lower submodelylow without valine (consisting only of creatinine in combination with myo-inositol) were interpreted as residuals. Each data point is one residual. When serum valine concentrations were plotted against theses residuals, the correlation coefficient significantly increased to r = 0.534 (97.5% CI 0.33 to 0.68). Hence, serum valine correlates with the residual variance of mGFR that contributions of creatinine and myo-inositol alone are unable to cover.

