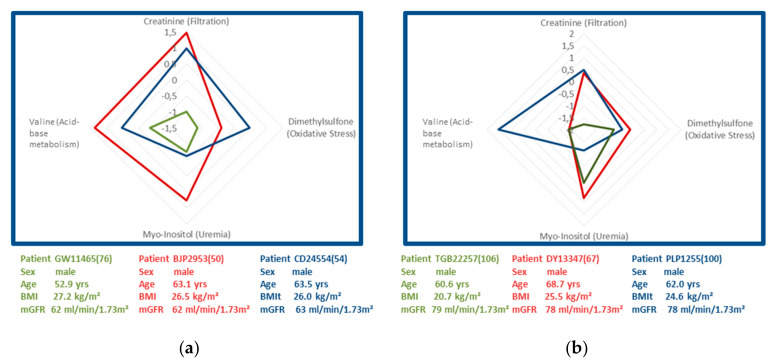
Figure 4.
Charts of two sets of three age-, sex-, and measured GFR-matched male patients with end-stage liver disease with CKD stage 2. (a) Mean mGFR were 62 mL/min/1.73 m2 (set 1) and (b) 78 mL/min/1.73 m2 (set 2), respectively. Measured biomarker concentrations were transformed into z-scores indicating the plus and minus standard deviation of substance concentrations from the mean of the total cohort. The obtained z-scores were plotted in a chart with one axis for creatinine (as a primary marker of filtration), a second for dimethyl sulfone (as a marker of oxidative stress), a third axis for myo-inositol (as a marker of uremia), and a fourth axis for valine (as a marker of acid-base metabolism).

