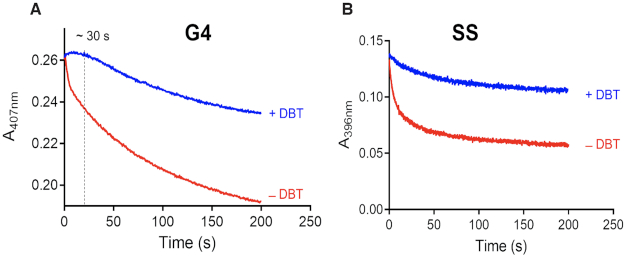
Figure 4.
(A) Absorbance at the Soret maximum (407 nm) for the G4–hemin complex (heme•DNAzyme) plotted as a function of time, in the presence and absence of the DBT substrate. (B) Absorbance of the hemin Soret maximum (396 nm), in the presence of SS DNA, plotted against time, again in the presence and absence of the DBT substrate. Time = 0 s traces are shown in red and time = 200 s in black.

