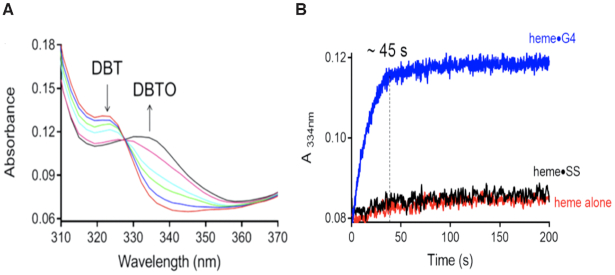
Figure 5.
(A) Time-dependence of spectral changes that are associated with the conversion of DBT to DBTO. Time = 0 s traces are shown in red and time = 200 s in black. (B) Plots of the change in absorbance at 334 nm over 200 s time in the catalyzed reaction of heme•G4 (blue trace) and the uncatalyzed reactions of heme•SS (black trace) and heme alone (red trace).

