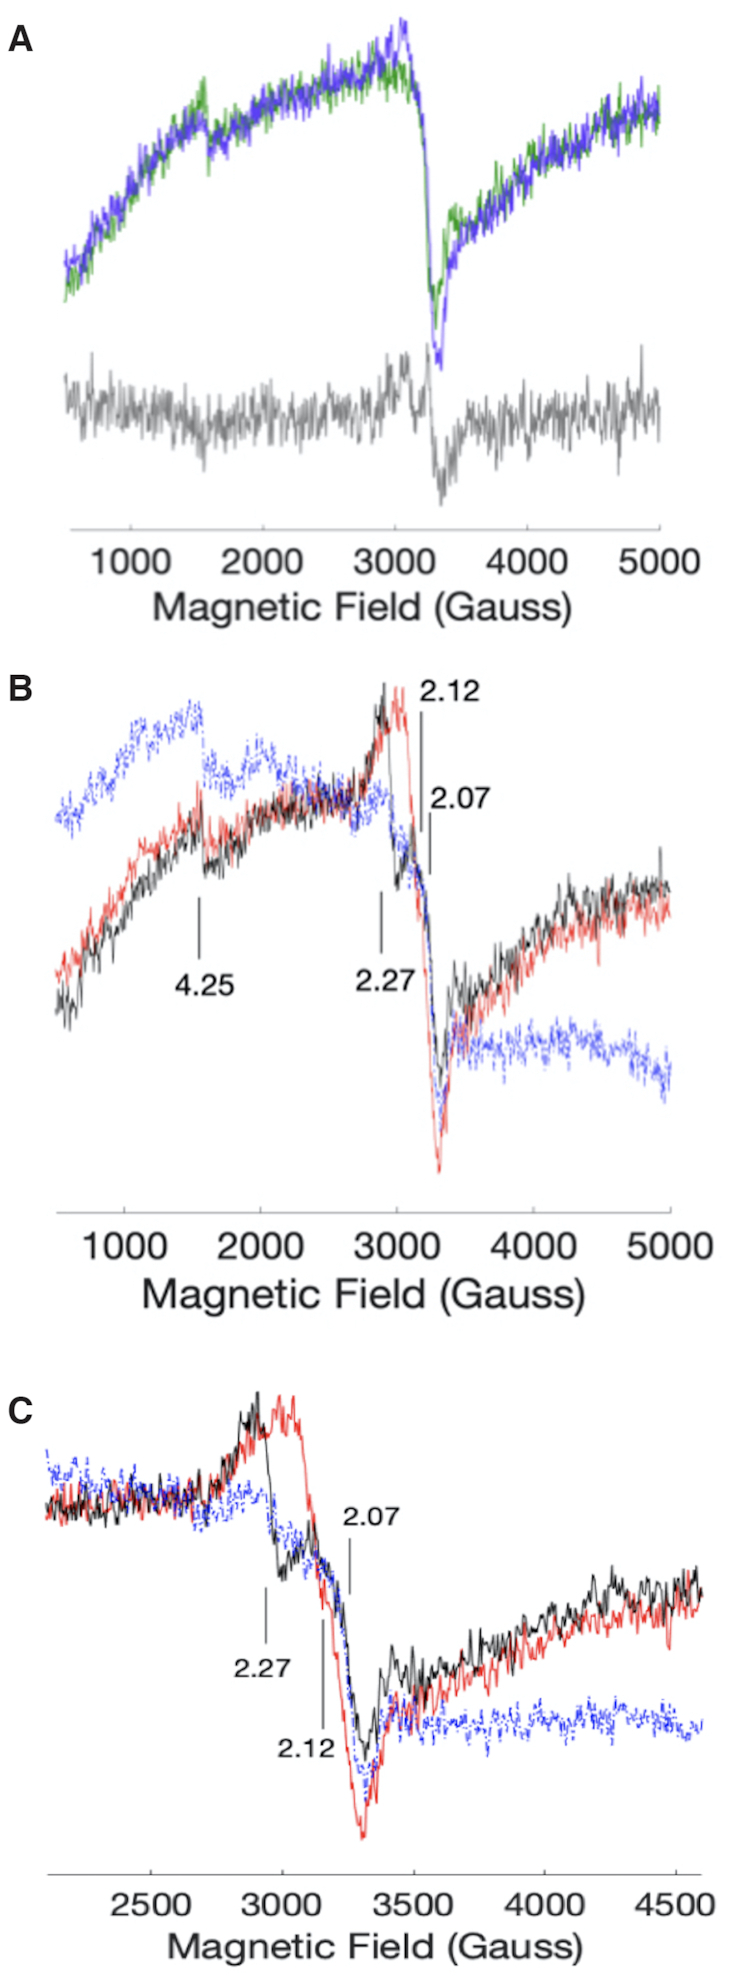
Figure 8.

(A) EPR spectra of SS DNA (green) and SS DNA + H2O2 (purple). The concentrations are 50, 7 and 500 μM of DNA, heme, and H2O2, respectively. The grey trace is the difference spectrum of the two samples. (B) EPR spectra of G4•heme (blue); G4•heme added to a solution of H2O2 (black); and, a solution of H2O2 added to G4•heme (red). (C) an x-axis expanded version of panel (b).
