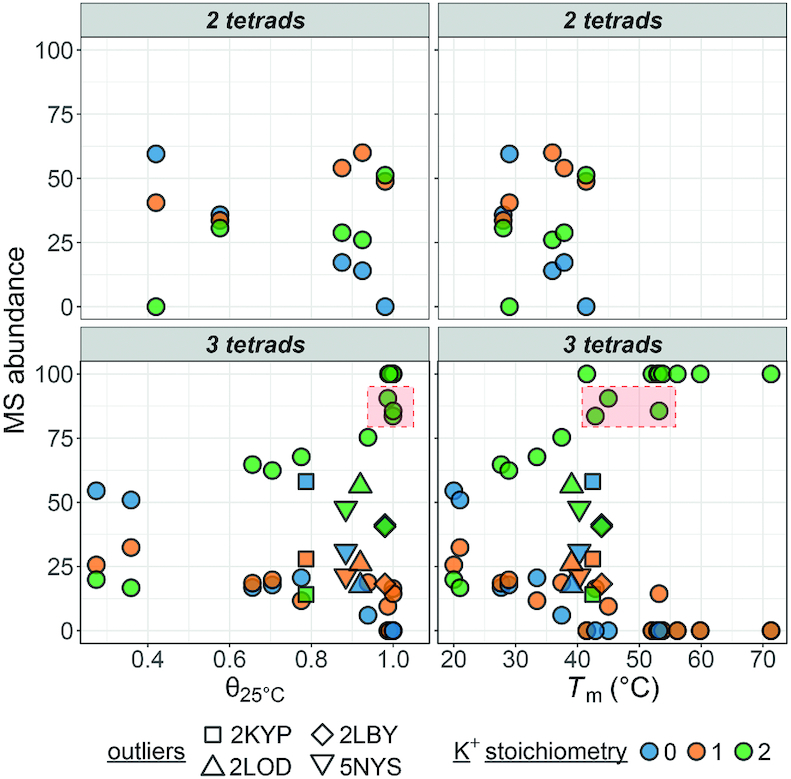
Figure 2.

Species abundance (%) on the 5- charge state in native ESI-MS experiments against their folded fraction at 25°C (left) or melting temperature (right) determined by UV-melting. The oligonucleotides are grouped in panels by their number of G-quartets, and colored by their number of potassium adducts. The 2-K+ data of slight outliers (2M27, 2KPR and 5YEY) is framed in red, while four other outliers are distinguished by specific symbols.
