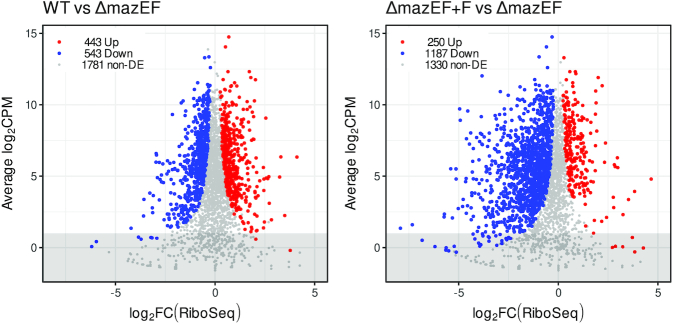
Figure 3.
Changes in translatome after mazF induction. log-FC in RPFs in WT compared to ΔmazEF (left) and in ΔmazEF+F compared to ΔmazEF (right). Genes with increased RPFs (P < 0.05), decreased RPFs (P < 0.05) and genes without significant change in RPFs (P > 0.05) are marked in red, blue and grey. Only genes with more than 40 reads per gene averaged per sample (above the grey highlighted region) were retained for the further analysis.

