Figure 6.
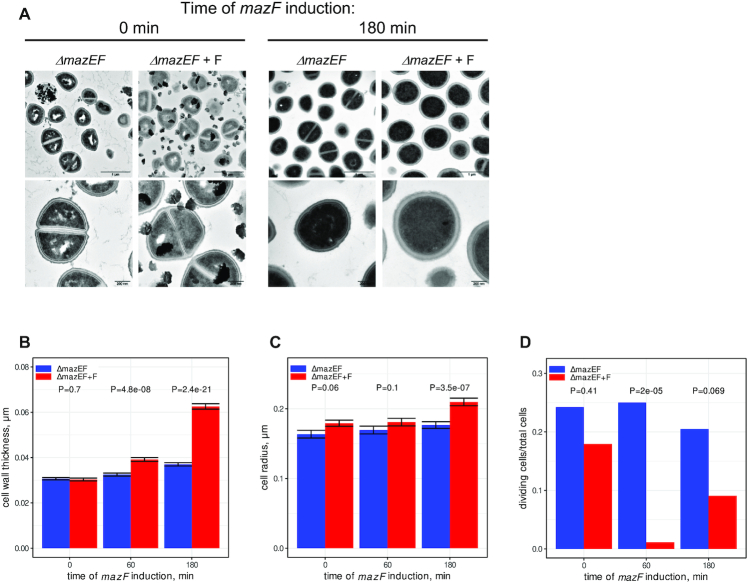
MazF increases thickness of cell wall and decreases cell division. (A) ΔmazEF cell carrying either empty vector or plasmid expressing MazF (ΔmazEF+F) were treated with ATc for 0, 10, 60 and 180 min to induce mazF expression and analyzed by transmission electron microscopy (TEM). Electron microscopy images are presented at 2 different magnifications (upper and lower panels), and the scale bars indicate 1 μm or 200 nm, respectively. Images at 0 and 180 min of induction are shown. More images are shown on the Supplementary Figure S13. (B and C) Analysis of cell wall thickness (B) and cell size (C) after 0, 60 and 180 min of mazF induction. ΔmazEF and ΔmazEF+F samples are indicated in blue and red, respectively. The error bars indicate standard deviations (SDs). The P-values were computed using two-sided Wilcoxon signed-rank test. (D) Analysis of cell division after 0, 60 and 180 min of mazF induction. The Fisher's exact test was used to compare the number of cells with and without division septum. P-values are indicated.

