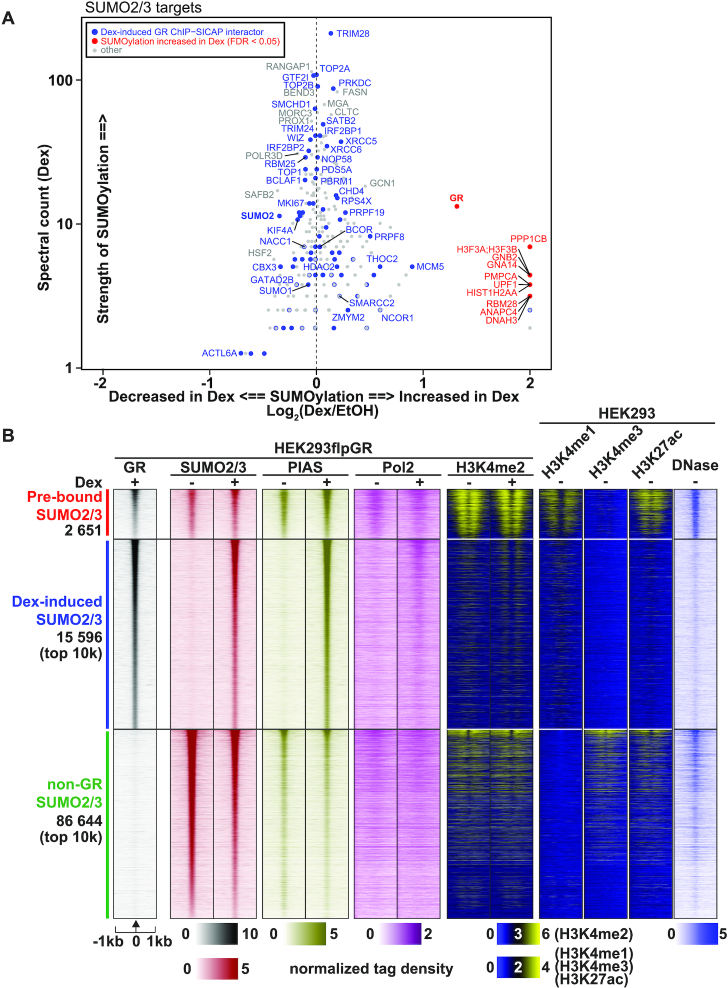
Figure 2.
GR and its chromatin partners are SUMO2/3 targets. (A) Scatterplot showing proteins identified as significantly SUMOylated (enriched over IgG, SAINTexpress FDR < 0.05) in SUMO2/3-pulldown in HEK293 cells expressing GR. X-axis shows the effect of Dex on the SUMOylation of each protein as Log2(Dex/EtOH). Spectral count (Dex) on the y-axis represents relative abundancy of the protein in the anti-SUMO2/3 immunoprecipitates. Spectral counts were normalized to the total spectral count sum of each sample. Significant (adj. P-value < 0.05) or imputed Dex-induced interactors identified with GR ChIP-SICAP are shown in blue. Proteins with significantly (FDR < 0.05) increased SUMOylation in Dex compared to vehicle are shown in red. There were no Dex-induced GR ChIP-SICAP interactors with significantly increased SUMOylation in Dex. (B) Heat maps representing GR, SUMO2/3, PIAS, Pol2 and H3K4me2 ChIP-seq data from HEK293flpGR (wt) in the presence and absence of Dex, and H3K4me1, H3K4me3 and H3K27ac ChIP-seq data from HEK293, and DNase-seq (DNase) data from HEK293T cells. Each heat map represents ±1kb around the center of the SUMO2/3 peak. Binding intensity (tags per bp per site) scale is noted below on a linear scale. All heat maps are normalized to a total of 10 million reads, and further to local tag density. Clusters represent from top to bottom; GR sites with pre-bound SUMO2/3, GR sites with Dex-induced SUMO2/3 (only top 10k shown), and non-GR SUMO2/3 sites (only top 10k shown).

