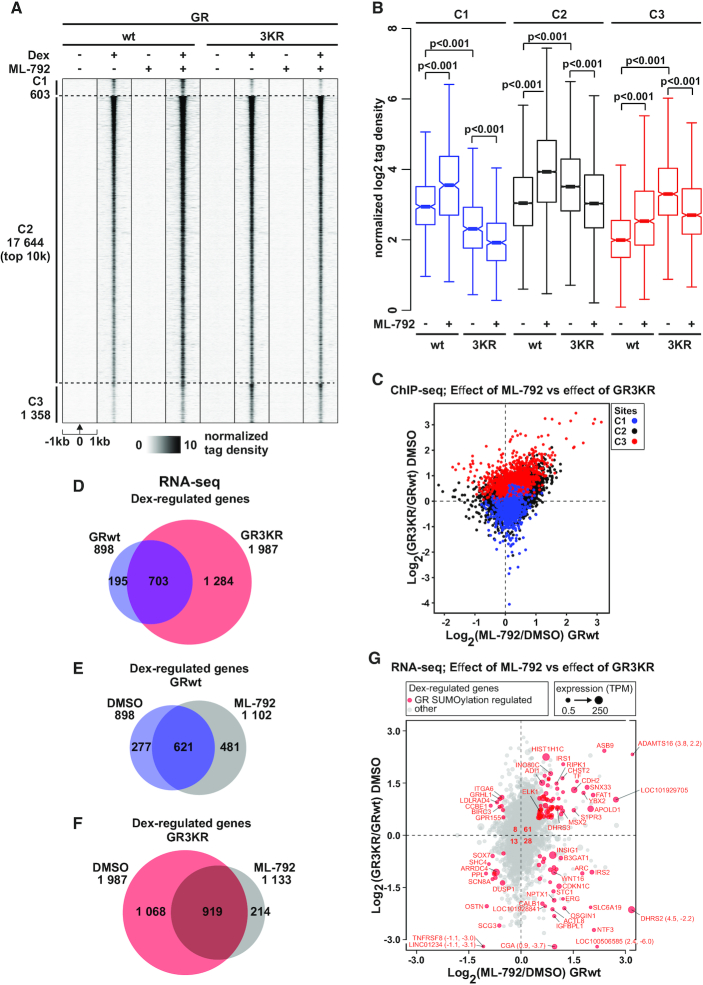
Figure 4.
SUMOylation inhibitor ML-792 blunts the differences in GR chromatin binding and target gene expression between GRwt and GR3KR cells. (A) GR ChIP-seq profiles from DMSO- or ML-792-treated HEK293flpGRwt (wt) and HEK293flpGR3KR (3KR) cells in the presence or absence of Dex. Each heat map represents ±1 kb around the center of the GR peak. C1 represents GRwt-preferred, C2-shared, and C3 GR3KR-preferred binding sites. Only top 10 000 sites (top 10k) are shown for C2. Binding intensity (tags per bp per site) scale is noted below on a linear scale. All heat maps are normalized to a total of 10 million reads, and further to local tag density. (B) Box plots representing normalized log2 tag density of ML-792 GR ChIP-seq data at C1 (blue), C2 (black) and C3 (red) sites. P-values were calculated with one-way ANOVA with Bonferroni post hoc test. All box plots are normalized to total of 10 million reads. Blue color represents GRwt (wt), red color GR3KR (3KR). (C) Scatter plot representing GR ChIP-seq log2 tag density of ML-792/DMSO from GRwt cells (x-axis) and GR3KR/GRwt from DMSO treated cells (y-axis). GR-binding clusters are color coded, C1 (blue), C2 (black) and C3 (red). (D–F) Comparison of Dex-regulated genes from RNA-seq between (D) DMSO-treated GRwt and GR3KR cells, (E) ML-792- and DMSO-treated GRwt cells, and (F) ML-792- and DMSO-treated GR3KR cells. (G) Scatter plot representing RNA-seq log2 fold change of ML-792/DMSO from GRwt cells (x-axis) and GR3KR/GRwt from DMSO treated cells (y-axis). Circle size depicts TPM values. Genes that are significantly regulated by both ML-792 (adjusted P-value < 0.01 and log2[ML-792/DMSO] > 0.5 or < –0.5) and GR3KR (adjusted P-value < 0.01 and log2[GR3KR/GRwt] > 0.5 or < –0.5) are highlighted in red (GR SUMOylation regulated genes). Number of GR SUMOylation regulated genes belonging to each sector is shown in the middle. Figure shows only genes that are Dex-regulated (adjusted P-value < 0.01 and log2[Dex/EtOH] > 0.5 or < –0.5).

