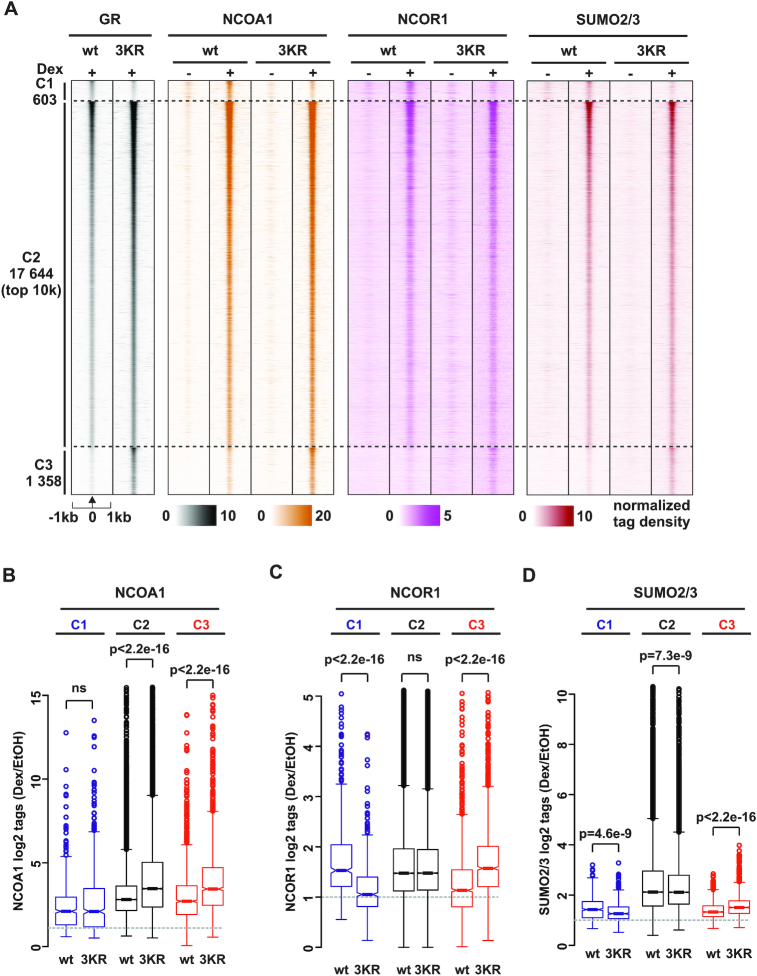
Figure 5.
Recruitment of NCOA1, but not NCOR1, to chromatin is influenced by SUMOylation status of GR. (A) Heat maps showing GR, NCOA1, NCOR1 and SUMO2/3 ChIP-seq profiles from HEK293flpGRwt (wt) and HEK293flpGR3KR (3KR) cells in the presence and absence of Dex. Each heat map represents ±1 kb around the center of the GR peak. C1 represent GRwt preferred, C2 shared, and C3 GR3KR preferred binding sites. Only top 10 000 sites (top 10k) are shown for C2. Binding intensity (tags per bp per site) scale is noted below on a linear scale. All heat maps are normalized to a total of 10 million reads, and further to local tag density. (B–D) Box plots representing normalized log2 tag density of Dex/EtOH for (B) NCOA1 (C) NCOR1 and (D) SUMO2/3 at C1 (blue), C2 (black) and C3 (red) sites. P-values were calculated using unpaired two-sample t-test. All box plots are normalized to total of 10 million reads.

