Figure 10.
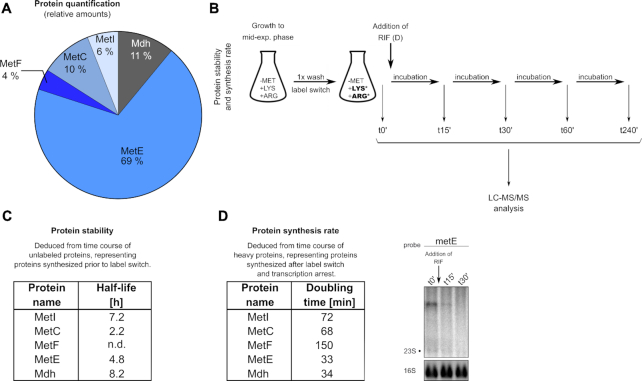
Detection of met operon-encoded proteins by proteomics. (A) Relative cellular protein amounts of met operon-encoded enzymes as detected by LC–MS/MS analysis. (B) Experimental design for protein stability (C) and protein synthesis rate (D) determinations. Asterisks (*) indicate the heavy amino acids lysine and arginine added upon label switch (see text for details). (C) Half-lives of met operon enzymes as calculated from LC-MS/MS data of unlabeled proteins. t0′, t15′, t30′, t60′ and t240′ samples were used for half-life determination. (D) Synthesis rates of met operon enzymes after transcription arrest by addition of rifampicin (RIF) as calculated from LC–MS/MS data of heavy proteins. t0′ and t30′ samples were used for determination of doubling time. Corresponding total RNA was run on an agarose gel. Northern blot was probed with metE-specific probe. Arrow marks addition of rifampicin. 16S rRNA detected in Midorigreen-stained gel is shown as loading control. (h), hours; (min) minutes; n.d., not determined.

