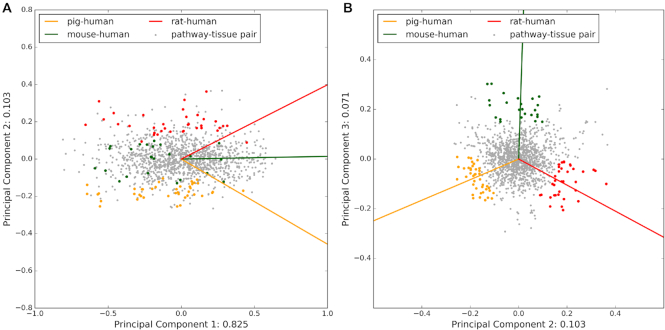
Figure 2.
Principal component analysis of the pathway–tissue agreement between human and animal models. PCA was performed on the Jaccard indices (JIs) for all pathway–tissue pairs (grey dots) with at least five expressed pathway genes, where the JIs represent the comparisons human–mouse, human–rat, and human–pig. The PCA loadings are shown as solid lines and colored by the model organism responsible for their direction. While the PC1 & PC2 plot (panel A) shows a clear separation between pathway–tissue pairs with high JI and thus, good agreement between human and the respective animal model, the PC2 & PC3 plot (panel B) clearly separates the data based on the differences between the animal models. The pathway–tissue pairs located closest to each loading and furthest away from the center of the PC2 & PC3 plot are colored in the same color as the organism loading to indicate that for these pairs, this organism agrees more with human than the others (see Methods section for more details).

