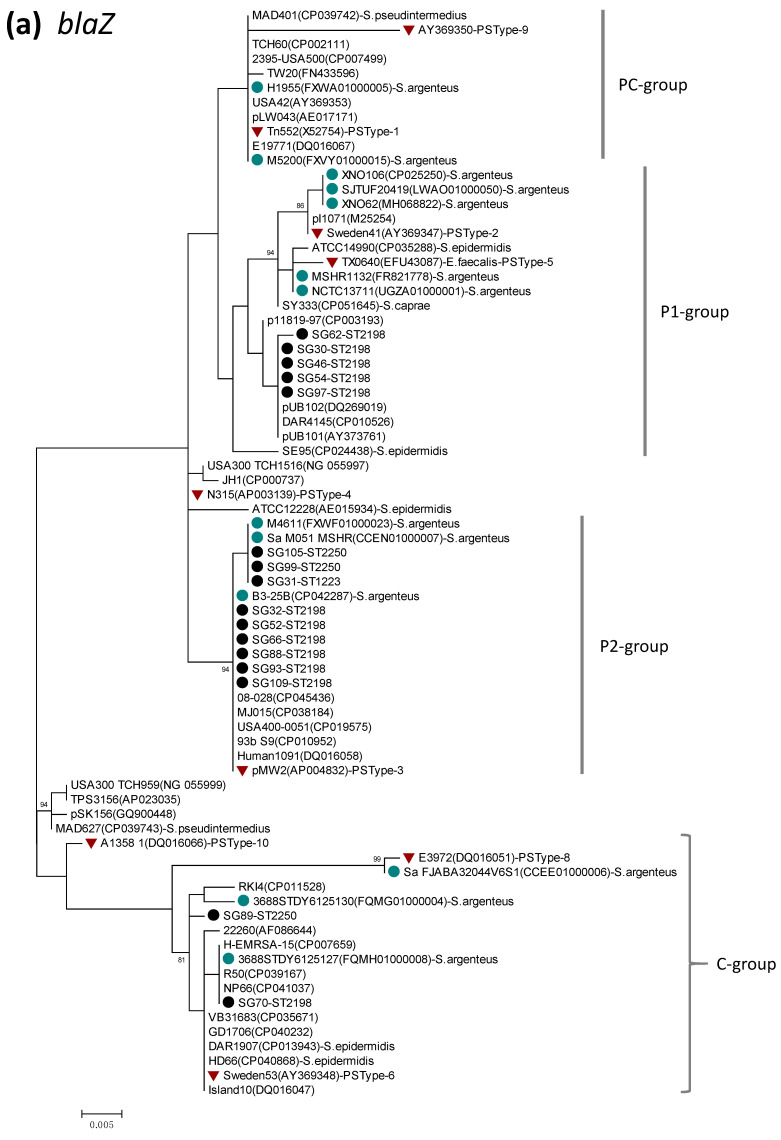
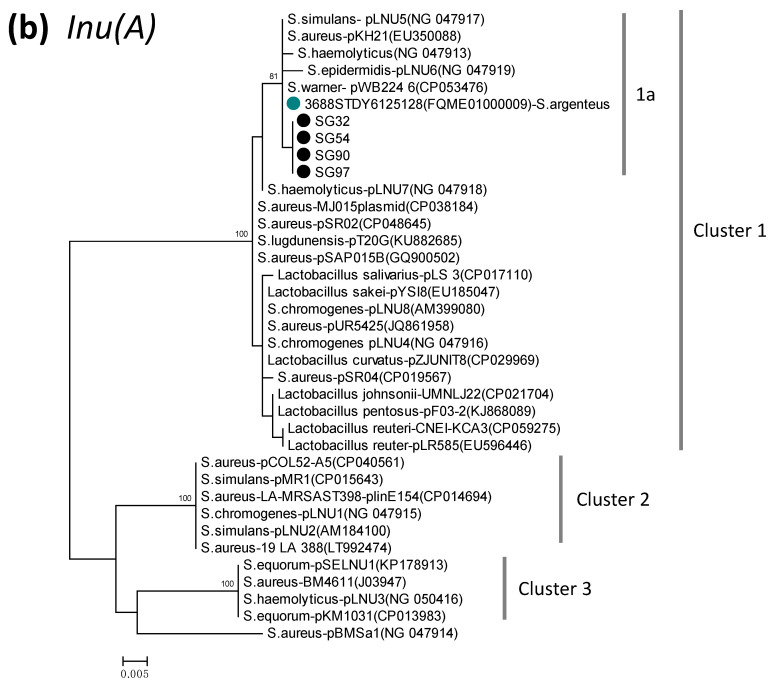
Figure 1.
Phylogenetic dendrogram of blaZ (a) and lnu(A) (b), constructed by the maximum likelihood method using MEGA X. The tree was statistically supported by bootstrapping with 1000 replicates, and genetic distances were calculated by the Kimura two-parameter model. Variation scale is provided at bottom. Percentage bootstrap support is indicated by values at each node (values <80 are omitted). Closed black and blue circles indicate S. argenteus isolates analyzed in the present study and strains available in the GenBank database, respectively. Inverted triangles denote genes of representative BlaZ protein sequence types (PS types) described previously [46], by which P (P1, P2)-, C-, and PC-groups were assigned as shown on the right (a). Cluster numbers 1–3 and subcluster 1a are shown on the right (b). The species name S. aureus was omitted (a), and GenBank accession numbers are shown in parenthesis followed by strain names.


