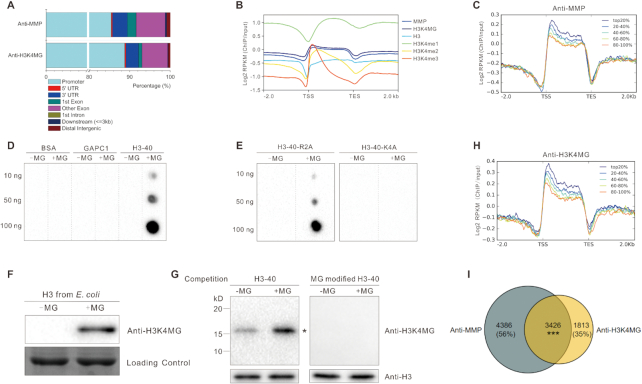
Figure 5.
H3 methylglyoxalation positively correlates with gene expression. (A) Peak annotation in 5-day-old wild-type seedlings treated with 200 μM MG for 12 h. (B) Average normalized ChIP-seq signals of anti-MMP, anti-H3K4MG, anti-H3, anti-H3K4me1, anti-H3K4me2 and anti-H3K4me3 in regions 2 kb upstream and downstream of genes. TSS and TES were aligned. RPKM is calculated as the number of reads mapping per kilobase of genomic region per million mapped reads. (C and H) Average normalized ChIP-seq signals of anti-MMP (C) and anti-H3K4MG (H) in regions 2 kb upstream and downstream of genes. All expressed genes (FPKM ≥1) in wild-type seedlings treated with MG are sorted into five equal-size groups according to their mRNA expression values (FPKM). Top20% stands for the highest expressed genes; 20–40%, 40–60%, and 60–80% are the medium expressed genes; 80–100% represents the lowest expressed genes. (D and E) Immunodetection of H3K4 methylglyoxalation in BSA, GAPC1, histone H3 peptide (H3–40) (D), and H3–40-R2A and H3–40-K4A (E), 10 μg/ml peptide was incubated with or without 200 μM MG at 37°C for 6 h. (F and G) Immunodetection of MG-modified histone H3 using anti-H3K4MG; the histone H3 was purified from E. coli and incubated with or without 200 μM MG at 37°C for 6 h (F), histones were extracted from 5-day-old wild-type seedlings treated or not with 200 μM MG for 12 h, Western blotting was carried out with competition of a native or MG-modified H3–40 peptide (G), asterisk indicates the bands of histone H3. (I) Venn diagram representing the number of target genes shared between anti-MMP and anti-H3K4MG. Significant level for the elements in common determined by Fisher's exact test: ***P < 0.001.

