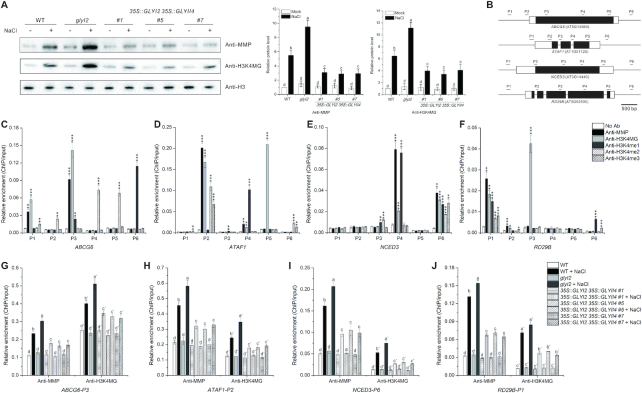
Figure 6.
H3 methylglyoxalation correlates with salt stress responsive gene expression. (A) Immunodetection of H3 and H3K4 methylglyoxalation in 5-day-old wild-type, glyI2 and 35S::GLYI2 35S::GLYII4 seedlings treated or not with 100 mM NaCl for 12 h. The intensity of each band was measured with an image-processing and analysis software package (Image J). Relative protein levels were normalized against those in wild-type seedlings, which were set to 1. Data are means ± SD of three independent biological replicates. Different letters indicate significant differences between the annotated columns (P < 0.05 by Tukey's test). (B) Schematic representation of regions that were tested using ChIP-qPCR. The black boxes correspond to exons and white boxes to 5’ or 3’ UTR. (C–F) Enrichment of ABCG6 (C), ATAF1 (D), NCED3 (E), and RD29B (F) DNA fragments following ChIP using anti-MMP, anti-H3K4MG, anti-H3K4me1, anti-H3K4me2, and anti-H3K4me3 in 5-day-old wild-type seedlings. ChIP values were normalized to their respective DNA inputs. Experiments were repeated three times with similar results. Data shown represented one biological replicate, and data for the other two biological replicates were shown in Supplementary Figure S9. Error bars indicate ±SE of three technical replicates. Asterisks indicate significant differences in comparison with the negative control (No Ab) (Student's t-test): *P < 0.05; **P < 0.01; ***, P < 0.001. (G–J) Enrichment of ABCG6-P3 (G), ATAF1-P2 (H), NCED3-P6 (I), and RD29B-P1 (J) DNA fragments following ChIP using anti-MMP and anti-H3K4MG in 5-day-old wild-type, glyI2, and 35S::GLYI2 35S::GLYII4 seedlings treated or not with 100 mM NaCl for 12 h. ChIP values were normalized to their respective DNA inputs. Experiments were repeated three times with similar results. Data shown represented one biological replicate, and data for the other two biological replicates were shown in Supplementary Figure S10. Error bars indicate ±SE of three technical replicates. Different letters indicate significant differences between the annotated columns (P < 0.05 by Tukey's test).

