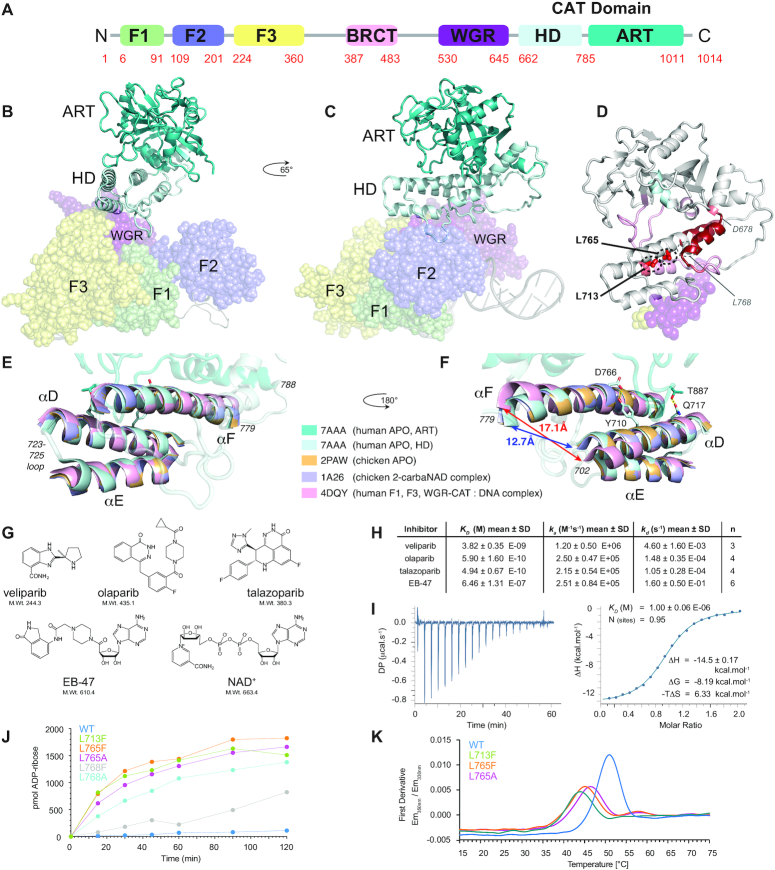
Figure 1.
(A) PARP-1 domain structure. (B, C) Model of PARP-1 bound to a DNA single-strand break, showing how the HD subdomain acts as a bridge between the DNA-interacting domains (F1, F2, F3 and WGR, shown as semi-transparent spheres) and the ART subdomain (shown as cartoon; the BRCT domain and interdomain linkers are not represented). The model was built by combining co-ordinates from PDB 4DQY (F1, F3 and WGR-CAT bound to a DNA blunt end) and PDB 2N8A (F1 and F2 bound to a 45-nucleotide DNA dumbbell that mimics a single-strand break) as described previously (14). (D) PARP-1 CAT domain showing locations of the HD subdomain mutations studied here (L713 and L765; also shown is the location L768, for mutants of which activity data was measured as a comparator), the parts of the surfaces of the WGR and F3 domains with which the HD subdomain interacts (shown as semi-transparent spheres), and a summary of the previously published HXMS data (16) showing NH exchange rate changes upon DNA binding for the CAT domain in the context of full-length PARP-1; progressively darker shades of red indicate progressively greater increases in NH exchange upon PARP-1 binding to the 45nt DNA dumbbell (see Dawicki-McKenna et al. (16) for a complete description). (E, F) Superpositions of PDB 1A26, PDB 2PAW and PDB 4DQY onto the structure of PDB 7AAA, using the backbone N, Cα, C′ atoms of helices D, E and F; for all four molecules, helices D, E and F are shown as solid, while the remainder of the structure is shown for 7AAA only and is semi-transparent. Changes caused by DNA binding (in 4DQY) include particularly a realignment of helix D and straightening of helix F. The H-bonds linking Tyr710 to Asp766 (at the site of the kink in helix F) and Thr887 to Gln717 are indicated (shown for 7AAA only), as is the position of the 723–725 loop. (G) Covalent structures of the four inhibitors studied here (veliparib, olaparib, talazoparib and EB-47) and PARP-1’s natural substrate, NAD+. (H) Binding affinities, association and dissociation rates for interaction of veliparib, olaparib, talazoparib and EB-47 with full-length PARP-1, measured using surface plasmon resonance. (I) Isothermal calorimetry determination of KD for the binding of PARP-1 CAT domain with EB-47. (J) Catalytic activity of isolated PARP-1 CAT domain and mutants, tested using a colorimetric assay that measures the incorporation of ADP-ribose into PAR using biotinylated NAD+ (22). (K) Thermal melt data for WT PARP-1 CAT domain and the L713F, L765F and L764A mutants, measured using nanoDSF (differential scanning fluorimetry); the corresponding raw data are shown in Supplementary Figure S4.

