Figure 2.
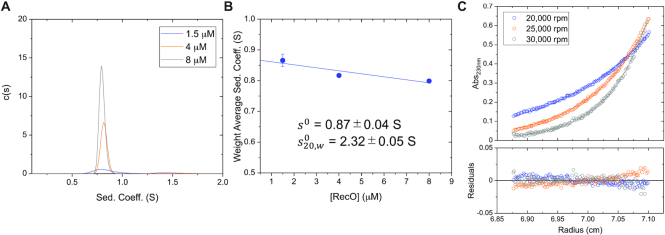
E. coli RecO is monomeric. (A) Sedimentation velocity c(s) distribution profiles of RecO (monitored at 230 nm) at 1.5, 4 and 8 μM in buffer BTP (pH 8.0) at 25°C. (B) The weight average sedimentation coefficient of RecO slightly decreases as a function of RecO concentration, expected for a pure, non-associating species (103–106). A linear extrapolation to zero RecO concentration yields s0 = 0.87 ± 0.04 S. From this we calculate  = 2.32 ± 0.05 S, consistent with a RecO monomer. (C) Results of sedimentation equilibrium experiments (monitored at 230 nm) performed at 4 μM RecO at three rotor speeds 20,000 (blue), 25 000 (orange) and 30 000 (gray) rpm are shown in blue, orange and gray. Each equilibrium profile is described by a single exponential. The solid lines show the best global NLLS fit of the three data sets to one-species model with mass constraints (Equation (2)) (99) yields a molecular weight estimate of 25.3 ± 0.3 kDa, consistent with the predicted molecular weight of 27.4 kDa for a RecO monomer. The bottom panel shows the residuals, indicating good fits.

