Figure 3.

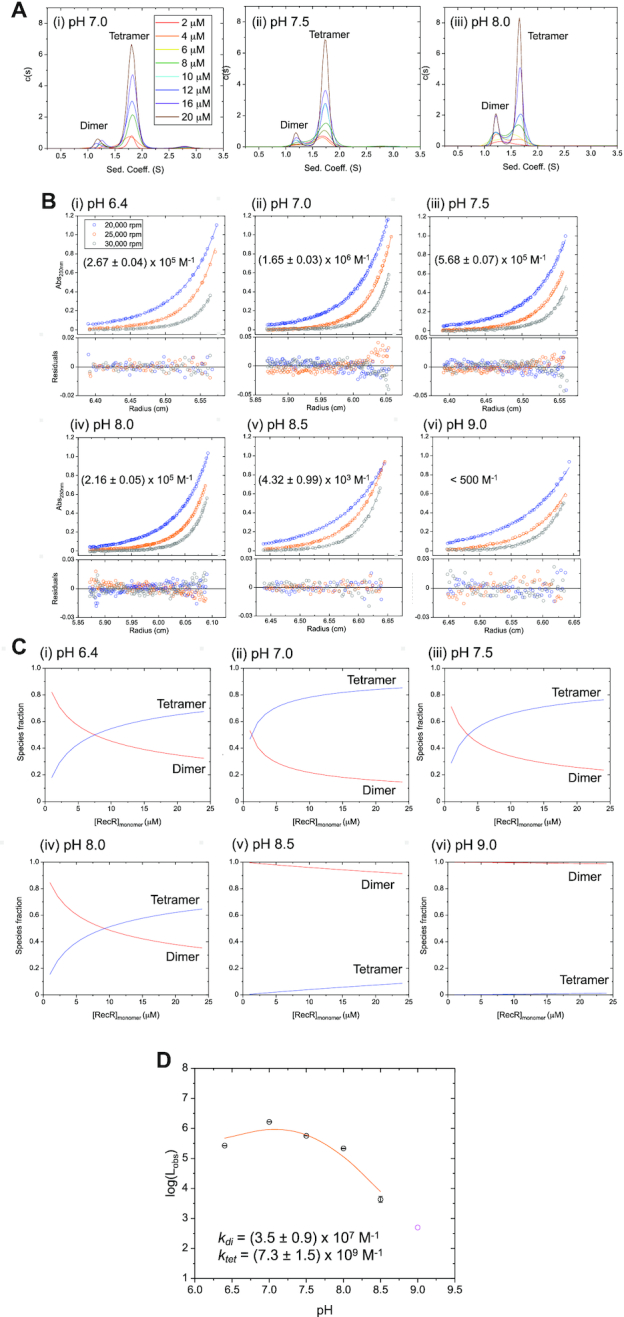
E. coli RecR exists in a pH-dependent dimer-tetramer equilibrium. (A) Sedimentation velocity (monitored at 233 nm) c(s) distribution profiles of 8 RecR concentrations between 2 and 20 μM (monomers) in buffer BTP at 25°C at (i) pH 7.0, (ii) pH 7.5, (iii) pH 8.0. Two major peaks are observed at 1.2 and 1.7 S, indicating two different assembly states of RecR. The area of the peak at 1.7 S increases with increasing RecR concentration. (B) Results of sedimentation equilibrium experiments (monitored at 230 nm) for RecR at 8 μMmonomer at 20 000 rpm (blue), 25 000 rpm (orange) and 30 000 rpm (gray) in buffer BTP at 25°C at (i) pH 6.4, (ii) 7.0 and (iii) pH 7.5 (iv) pH 8.0, (v) 8.5, (vi) 9.0. The solid lines show the best global NLLS fits of the three sets of data to a dimer-tetramer equilibrium model (Equation (3)) with MW of the RecR dimer and tetramer fixed at 43.9 and 87.8 kDa, respectively (99). The dimer-tetramer equilibrium constants, Lobs (noted in each panel and given in Table 1), were determined from this analysis. The residuals from the fits are shown in bottom panels. The data at pH 8.0 was also fitted to a two-species model with mass constraint where the MW of the RecR dimer was fixed at 43.9 kDa while the MW of the tetramer was fitted to 85.8 ± 0.2 kDa, close to the expected MW for a RecR tetramer (87.8 kDa). (C) Simulated species fractions of dimers (red) and tetramers (blue) plotted as a function of [RecR] (monomers). Fractions of each species were simulated with a dimer–tetramer model (Equations (4) and (5)) using the tetramerization equilibrium constants (Lobs) obtained from sedimentation equilibrium experiments shown in panel (b) as a fixed parameter. Consistent with the sedimentation velocity c(s) profiles panel (a), the tetrameric population increases with increasing [RecR] and decreasing pH. (D) Plot of log(Lobs) versus pH with obtained Lobs values from sedimentation equilibrium experiments in panel (B). The value of Lobs at pH 9.0 (magenta circle) is only an upper limit and was excluded from the following analysis. The solid line shows the best fit to a dimer–tetramer equilibrium model (Equation (7)) assuming two independent and identical protonation sites on the RecR dimer and three cooperative sites on the tetramer (ktet = (7.3 ± 1.5) × 109 M−1, kdi = (3.5 ± 0.9) × 107 M−1). Other models of different number of protonation sites were considered but did not fit the data as well (Supplementary Figure S1).
