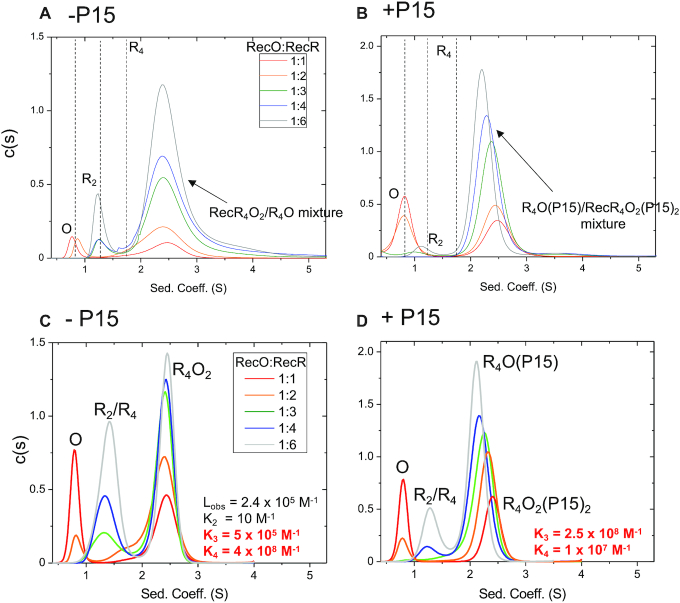
Figure 4.
RecO binds to the RecR tetramer. RecO (1.5 μM) was titrated with increasing concentrations of RecR (1.5–9 μM) by sedimentation velocity (monitored at 230 nm) in the presence and absence of SSB-Ct peptide (P15) in buffer BTP (pH 8.0) at 25.0°C. (A) c(s) distribution profiles in the absence of P15 at the indicated molar ratios of [RecO]:[RecR] (monomers). The dotted lines show sedimentation coefficients for individual RecO, RecR2 and RecR4 species determined from isolated proteins. At 1:1 (red) and 1:2 (orange), the distributions show free RecO species at 0.8 S and a RecOR complex at 2.5 S. At molar ratios of 1:3 (green), 1:4 (blue), 1:6 (gray), free RecR dimer is observed at 1.2 S in addition to RecOR complex peaks at ∼2.5 S that show a slight shift to the left with increasing [RecR]. Since free RecO is not observed at the molar ratio of 1:3 and beyond, the observation of free RecR2 peak with RecOR peaks that shift to a lower sedimentation coefficient value indicate that a mixture of RecOR complex is present and that a RecOR complex with a lower MW forms at higher [RecR]. (B) In the presence of P15, free RecO is observed at 0.8 S for 1:1 (red) and 1:2 (orange) molar ratios in addition to a RecOR complex peak at ∼2.5 S. A free RecR2 species (1.2 S) is observed at higher [RecR]. Note that the RecOR complex peaks notably shift from 2.5 to 2.3 S at higher [RecR], indicating a significant formation of RecOR complex of lower MW. This shift is notably more significant than in the absence of P15. Panels (c) and (d) show simulations of titration of RecO (1.5 μM) with RecR (1.5–9 μM) by sedimentation velocity experiments monitoring at 230 nm at 42 000 rpm in buffer BTP (pH 8.0) at 25°C. (C) c(s) distribution profiles of simulated data with K3 = 5 × 10⁵ and K4 = 4 × 10⁸ M−1 describe the experimental data best in the absence of P15. A free RecO species is observed at 0.8 S, free RecR species at ∼1.2–1.4 S, and RecR4O2 complex species at ∼2.5 S. Simulations show that all of RecO is bound for RecR  4.5 μM as in experiments and the area of free RecR species increase with increasing [RecR]. The RecOR complex peak is positioned at 2.5 S, reflecting that primarily RecR4O2 complex is present in a mixture of RecR4O and RecR4O2 complexes. The relative increase and decrease of areas of each species are similar to those in experiments, but the absolute areas differ, which is likely due to the less precise extinction coefficients at 230 nm than those at 280 nm, and we consider these differences in peak areas to be minor. (D) In the presence of P15, simulated data with K3 = 2.5 × 10⁸ and K4 = 1 × 10⁷ M−1 describe the experimental data best.

