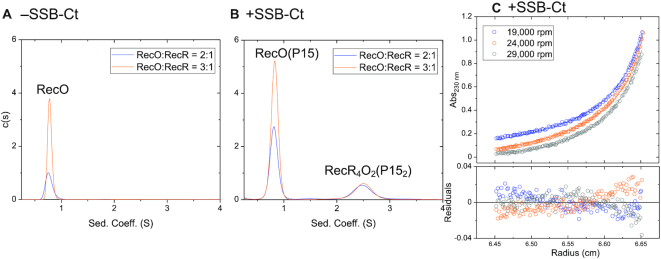
Figure 6.
Binding of the SSB Ct acidic tip to RecO enhances its affinity for the RecR tetramer. Sedimentation velocity (monitored at 230 nm) c(s) distribution profiles in buffer BTP (pH 8.0) at 25°C titrating RecR (2 μM in monomers) with RecO (4 μM (blue) and 6 μM (orange)). (A) In the absence of P15, only free RecO is observed at 0.8 S and no RecOR complex species is observed. However, a decrease in the initial absorbance compared to an expected value predicted from initial [RecO] and [RecR] indicates that larger RecOR complex aggregate has formed and sedimented to the bottom of the cell. (B) In the presence of P15, (24 μM for 2:1 molar ratio and 36 μM for 3:1 molar ratio, 6-fold molar excess to RecO), a RecOR complex is observed at ∼2.5 S along with free RecO at 0.8 S at the two molar ratios of RecO to RecR. Increasing [RecO] from 2:1 molar ratio to 3:1 increases the area of the free RecO peak (0.8 S) but does not increase the area of the RecOR complex peak, indicating RecR is saturated with RecO. (C) Results of sedimentation equilibrium experiments (monitored at 230 nm) performed in buffer BTP (pH 8.0) at 25°C with RecR (2 μMmonomer), RecO (6 μM, 3:1 molar ratio) and P15 (36 μM, P15/RecO molar ratio of 6:1) at three rotor speeds (19 000 (blue), 24 000 (orange) and 29 000 (gray) rpm). The data were described by two exponentials and fit to a two-species model with mass constraint (Equation (2)) with the MW of one species fixed at 29.1 kDa (RecO–P15 complex). A global NLLS analysis of the data yielded a MW for the second species of 144.5 ± 3.1 kDa, suggesting a RecR4O2 complex bound with two P15 peptides.

