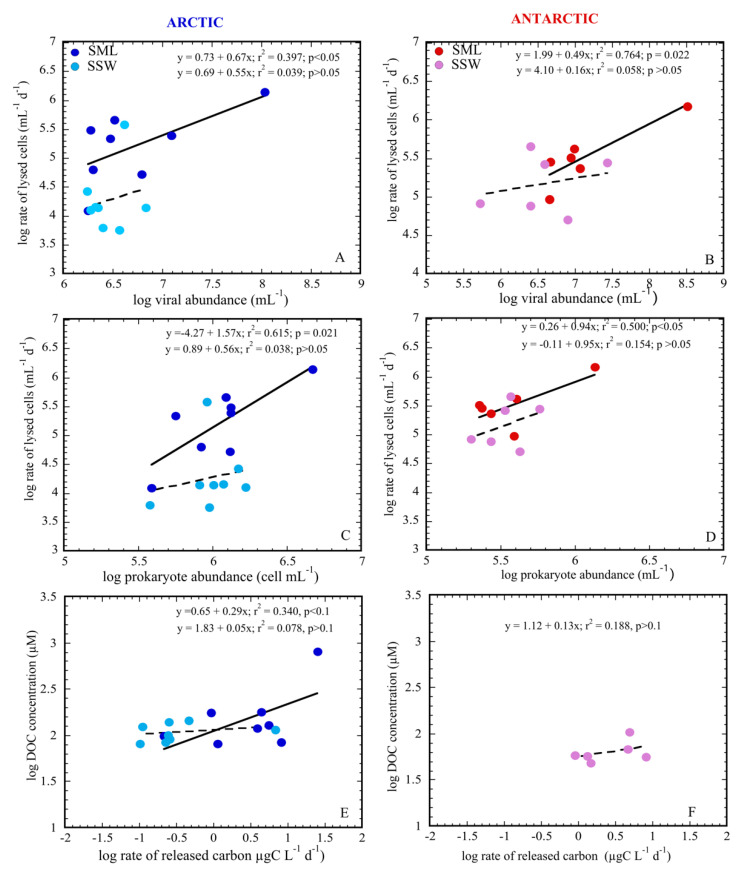
Figure 4.
Regression analyses between the rate of lysed cells (RLC) with viral and host abundances, and the rate of released carbon with DOC in Arctic (A,C,E) and Antarctic (B,D,F) waters for the SML and SSW. Significant levels of p < 0.05 and of 0.05 < p < 0.1 were considered. Analyses and drawings were performed using the JMP 8.0 and Kaleidagraph 4.0 programs.

