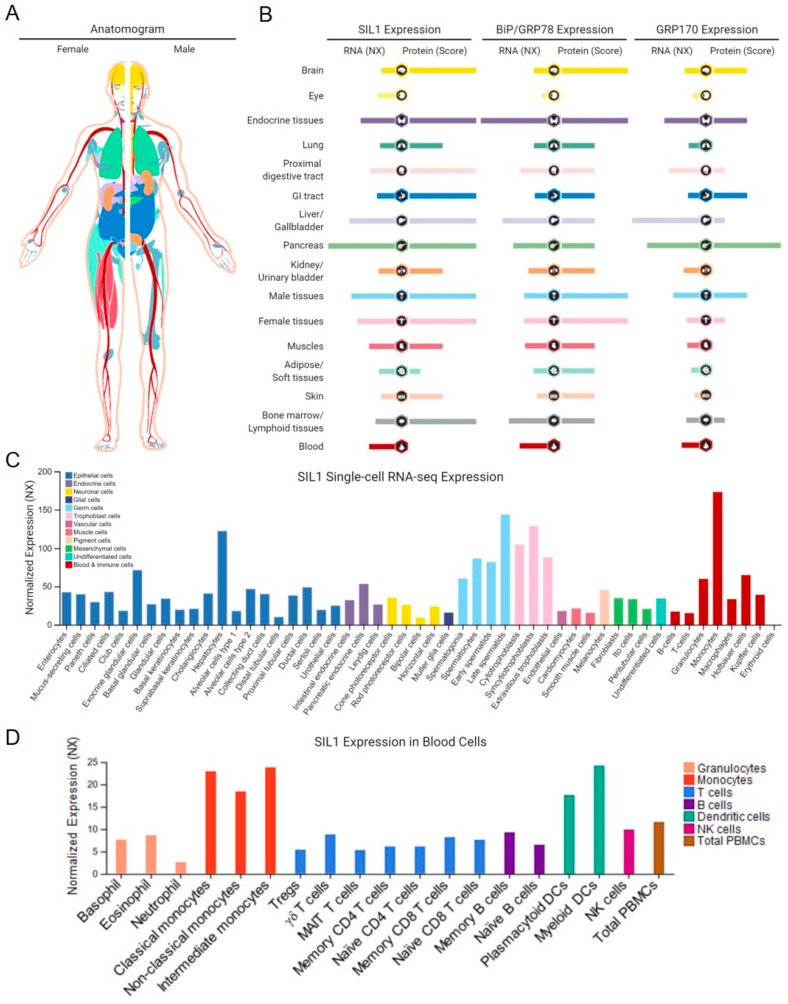
Figure 3.
Tissue-specific and cellular expression of SIL1. (A) An anatomogram with color-coded tissues used to denote SIL1 expression. (B) An overview of normalized RNA expression (NX; RNA-seq data derived from Human Protein Atlas, FANTOM5, and GTEx consortia) and protein scores of SIL1, BiP, and GRP170, respectively, from 16 healthy organ and tissue systems, representing similarities between SIL1 and BiP expression patterns and some differences between those of SIL1 and GRP170. (C) Summary of single-cell RNA-seq normalized expression (NX) from 51 cell types. Color-coding varies from (A,B) and is based on cell types with common functional features. (D) SIL1 mRNA expression in 18 blood cell types and total peripheral blood mononuclear cells. Color-coding is based on blood cell type lineages, including B-cells, T-cells, NK-cells, monocytes, granulocytes, and dendritic cells, as well as total PBMC. Data credits: Human Protein Atlas. Data images were obtained from proteinatlas.org/ENSG00000120725-SIL1.

