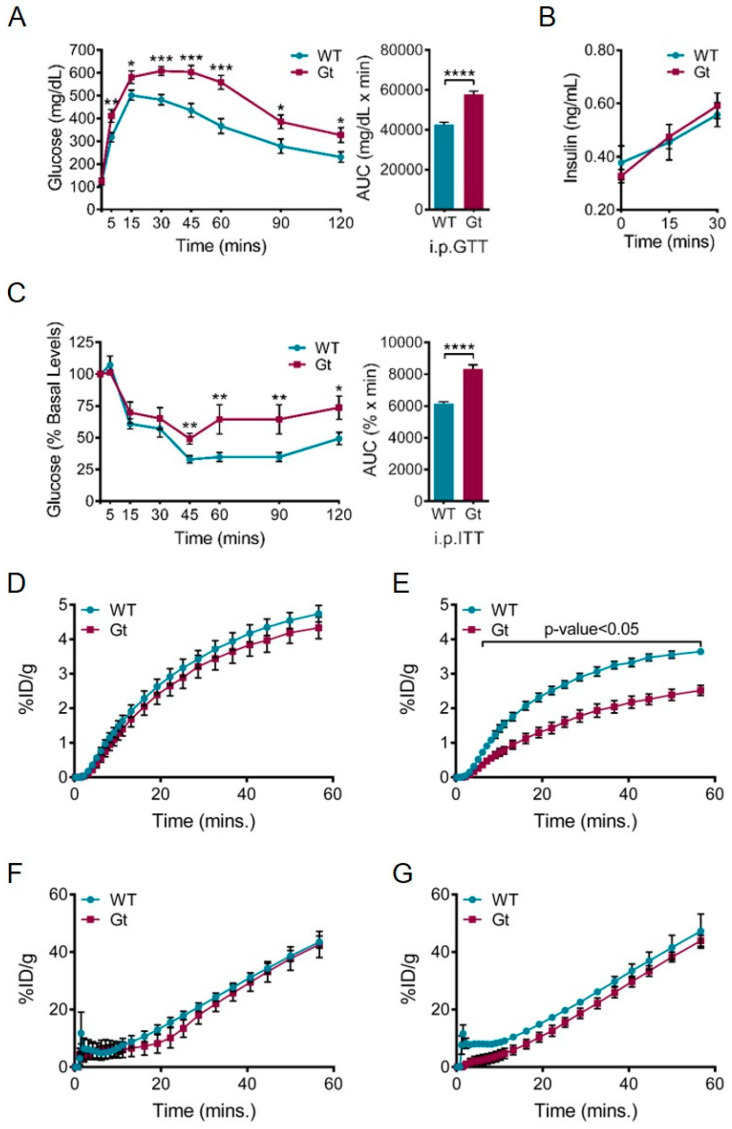
Figure 5.
Loss of SIL1 leads to systemic defects in glucose homeostasis in Sil1Gt mice. (A–C) Sil1Gt mice demonstrate glucose intolerance and insulin resistance. Age-matched wild-type and Sil1Gt mice (n = 8–12) were subjected to an (A) intraperitoneal glucose tolerance test (i.p.GTT) where d-glucose was administered at a dose of 2 mg/g body weight, or (C) an intraperitoneal insulin tolerance test (i.p.ITT) where human insulin was administered at a dose of 0.5 mU/g body weight, following which blood glucose was measured at the indicated time-points. Area under curve (AUC) calculations for each test are displayed next to the respective blood glucose levels. Error bars indicate means ± s.e.m. (B) Plasma insulin levels during the initial time-course of the i.p.GTT were measured and plotted. Statistical comparisons were performed using t-tests; p-values are indicated as * p ≤ 0.05, ** p ≤ 0.01, *** p ≤ 0.001, **** p ≤ 0.0001. (D–G) Graphical representation of 18F-fluorodeoxyglucose (18F-FDG) uptake over 60 min in wild-type (blue) and Sil1Gt (red) brains (D,E) and urinary bladders (F,G) under basal conditions (D,F) or after an intraperitoneal injection of 0.75 mU/g body weight of human insulin (E,G; n = 4) assayed by PET-µCT. Urinary bladder serves as a control tissue that should not demonstrate differences in 18F-FDG uptake between Sil1Gt and wild-type mice. Statistical differences were computed using unpaired, two-tailed Student’s t-tests and are indicated in the graph. %ID/g, % injected dose per gram body weight.

