Figure 2.
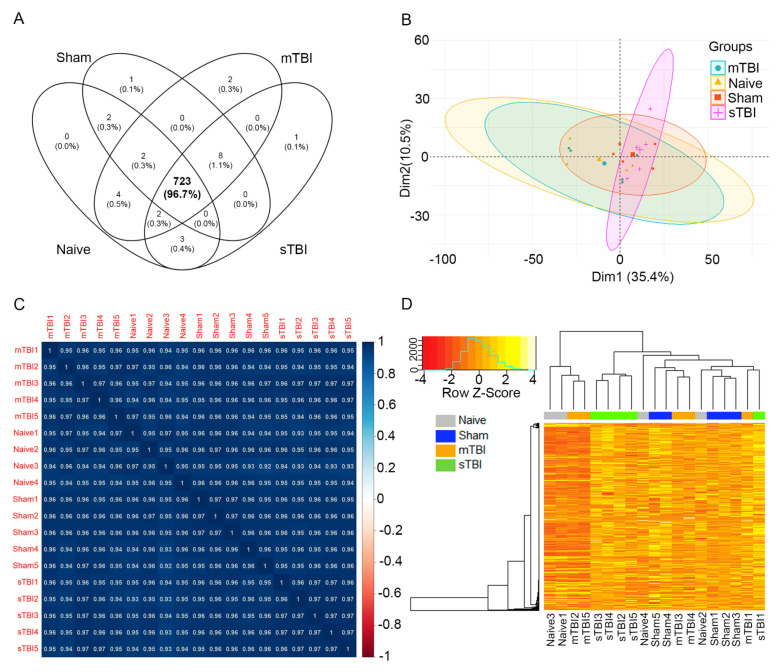
The overall miRNA expression profile in rat plasma was similar between the TBI and control groups. (A) Venn-diagram of micro RNAs expressed in each group (naïve, sham, mTBI, sTBI). Among the 748 miRNAs detected across all samples in miR-sequencing, 723 (97%) were commonly expressed in all 4 groups. (B) Principal component analysis revealed overall similarity in the miRNA expression profile in the four groups, as the first two components (Dim1 + Dim2) explained only 46% of the variance in the dataset. (C) High positive Spearman correlation coefficients were observed across all samples. (D) Heatmap based on Spearman rank correlation as the distance matrix also indicated similar miRNA expression profile across groups (no clustering of cases). Top shows the clustering of samples, left the clustering of miRNAs, and bottom the individual animals. Abbreviations: Dim1, dimension 1; Dim 2, dimension 2; mTBI, mild traumatic brain injury; sham, sham-operated experimental controls; sTBI, severe traumatic brain injury; Z-Score, measure of distance in standard deviations from the mean.

