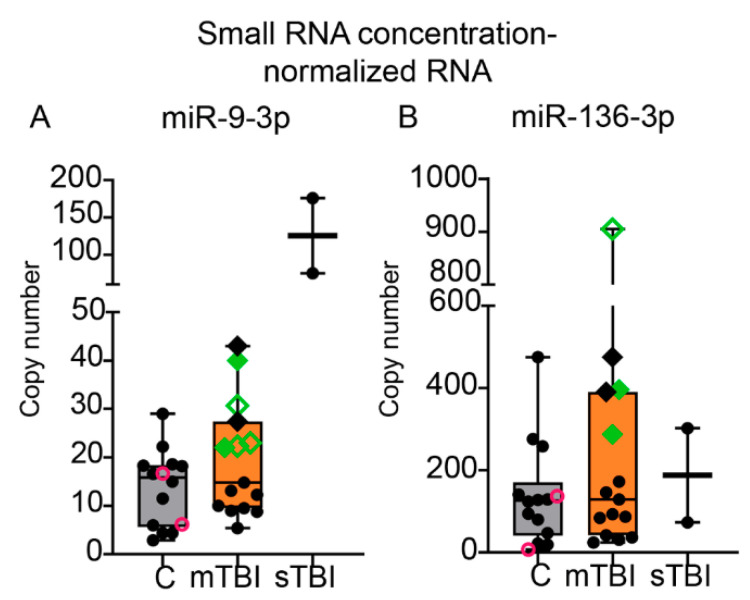
Figure 8.
ddPCR revealed elevated miR-9-3p and miR-136-3p levels in a subpopulation of mTBI patients that also had high plasma S100B levels. Whisker-plots (box extends from the 25th–75th percentiles) shows that (A) mean miR-9-3p copy numbers (per 20 µL of PCR reaction volume, normalized for total small-RNA concentration, y-axis) were similar between the mTBI and controls (x-axis, p > 0.05). In 7 of the 15 mTBI patients (diamonds), however, miR-9-3p levels were higher than mean + 1SD of control mean (>21 copies). miR-9-3p levels in the sTBI patients were 9.2-fold compared to that in the controls and 6.5-fold compared to that in the mTBI group, suggesting a trend toward an injury-severity effect. (B) Mean miR-136-3p copy numbers did not differ between the mTBI patients and controls (p > 0.05). In 5 of the 15 mTBI patients (diamonds), miR-136-3p copy number was higher than mean + 1SD of the control mean (>264 copies). Unlike miR-9-3p, data from the sTBI patients did not suggest any injury-severity effect. In two mTBI patients, the miR-9-3p and miR-136-3p levels were higher than mean + 1SD of that in controls, and the plasma S100B levels were higher than the reference of 0.1 µg/L (solid green diamonds). Statistical test: (Mann–Whitney U test). Abbreviations: C, age-matched controls; mTBI, mild traumatic brain injury; sTBI, severe traumatic brain injury. Symbol key: open pink circles indicate the controls age-matched with the sTBI patients; black solid diamonds indicate the mTBI patients with plasma S100B level < 0.1 µg/L but plasma miR-9-3p and miR-136-3p levels > mean + 1SD of the controls; green solid diamonds indicate the mTBI patients with plasma S100B level > 0.1 µg/L as well as plasma miR-9-3p and miR-136-3p levels > mean + 1SD of the controls; open green diamonds indicate the mTBI patients with plasma S100B level >0.1 µg/L and either plasma miR-9-3p level or miR-136-3p level > mean + 1SD of the controls.

