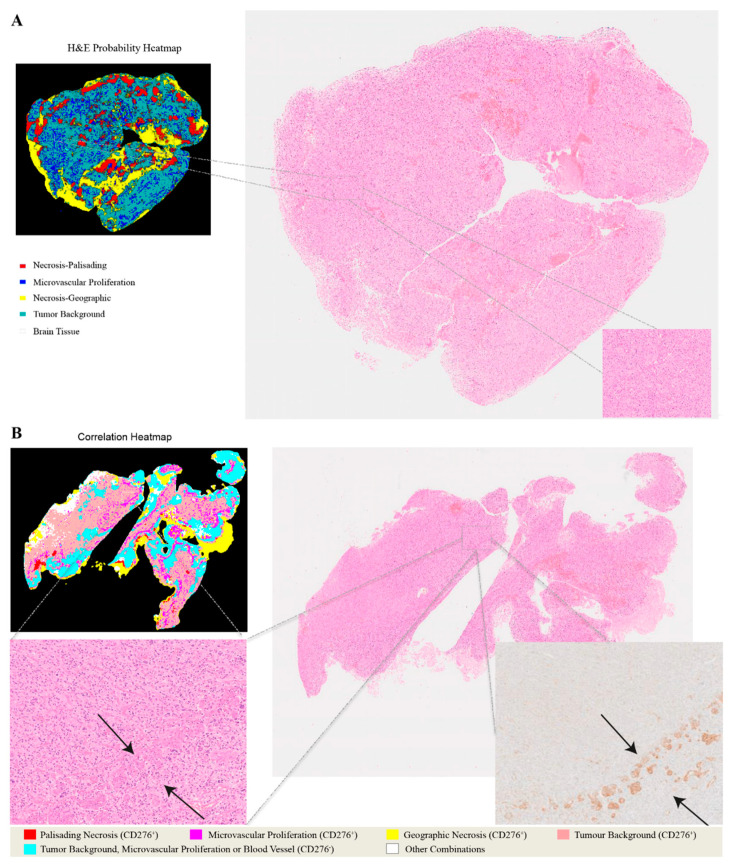
Figure 4.
Heatmaps illustrating the relationship between H&E images and CD276 immunohistochemistry. (A) Predicted probability heatmap of key morphological features in relation to the corresponding H&E image. (B) Correlation heatmap and the spatial overlaps between H&E-stained morphological structures and CD276 immunoreactivity.

