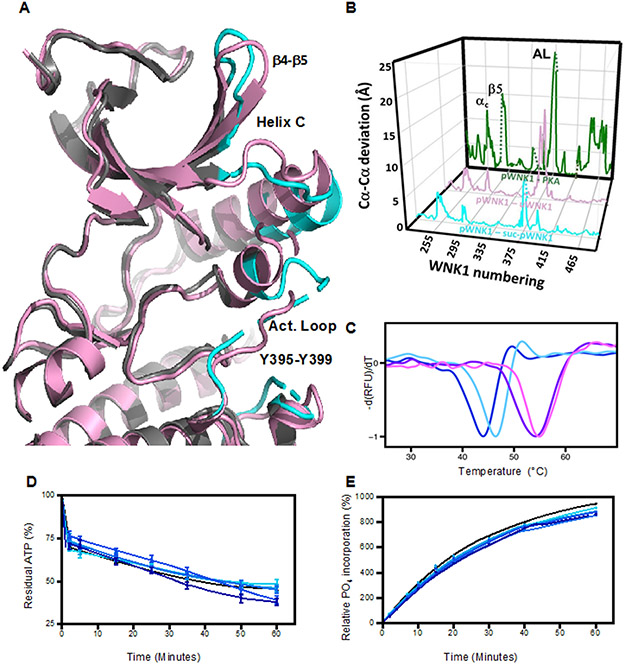
Figure 3.
Effects of sucrose on pWNK1 and pWNK3. (A) Overlay of the AMP-PNP complexed pWNK1 structure in the presence (magenta) and absence (gray) of sucrose (0.6 M). Activation loop, helix C and β4-β5 of suc-pWNK1 are shown in cyan. (B) Placement of conformational changes along the sequence (WNK1 numbering) between pWNK1 and PKA (green), pWNK1 and uWNK1 (pink), and pWNK1 and suc-pWNK1 with 0.6 M sucrose (cyan). (C) DSF melt temperatures (Tm) of pWNK1 in the absence (blue) and presence (cyan) of 0.6 M sucrose and pWNK3 in the absence (purple) and presence (violet) of 0.6 M sucrose. Note that the DSF conditions differ from the crystallographic study in A. * Trace is the negative first derivative of fluorescence from Sypro orange. Note that sucrose stabilizes pWNK1 and pWNK3. (D) Progress curves for the activity of pWNK1 on gOSR1 in increasing sucrose concentrations (0 mM, 50 mM, 100 mM, 200 mM, 400 mM, and 600 mM sucrose shown in colors shifting from black to cyan) tracking the disappearance of ATP using Kinase-Glo®. (E) Progress curves as in (D) following the incorporation of 32P into total protein (4 μM pWNK1 and 40 μM gOSR1) using [γ-32]P ATP with increasing sucrose concentrations (same concentrations and coloring as in (D)). Representative data from three replicates shown in (C). Progress curves in (D) reflect 5 simultaneous experiments, each having 3 independent replicates. Error bars are standard error. Panel E shows 5 simultaneous experiments, with autoradiography shown in Figure S2A. * “Additional DSF experiments with Mg+2 and AMP-PNP added as controls could not be conducted at submission on account of the COVID-19 lockdown.”

