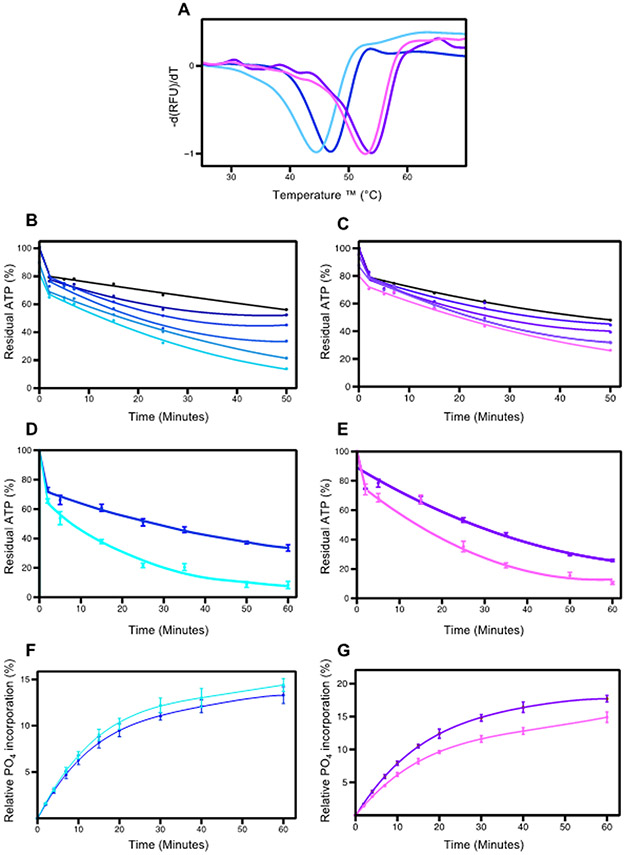
Figure 4.
Effects of PEG400 on pWNK1 and pWNK3. (A) DSF Melt temperatures (Tm) of pWNK1 (blue/cyan) and pWNK3 (purple/violet) with and without 15% PEG400. Note the reduced thermal stability in PEG400. (B) Progress curves for the activity of pWNK1 on gOSR1 in increasing PEG400 concentrations (0 mM, 50 mM, 100 mM, 200 mM, 400 mM, 600 mM in shades of blue from black to cyan) tracking the disappearance of ATP using Kinase-Glo®. (C) Progress curves for pWNK3 activity, PEG400 concentrations as in (B) with colors shifting from black to violet with increasing sucrose. (D) Progress curves for the activity of pWNK1 on gOSR1 with (cyan) and without (blue) 15%PEG400, tracking the disappearance of ATP using Kinase-Glo®. (E) Progress curves for the activity of pWNK3 on gOSR1 with (violet) and without (purple) 15%PEG400, as in (D). (F) Progress curves for the activity of pWNK1 on gOSR1 with (cyan) and without (blue) 15%PEG400, following the incorporation of 32P into total protein. Autoradiography in Figure S2B. (G) Progress curves for the activity of pWNK3 on gOSR1 with (violet) and without (purple) 15%PEG400, as in (F) Autoradiography in Figure S2C. Representative data from three replicates shown in (A). Panels B and C represent 5 simultaneous experiments. Panels D, E, F, and G reflect data from 3 experimental replicates. Error bars are standard error.

