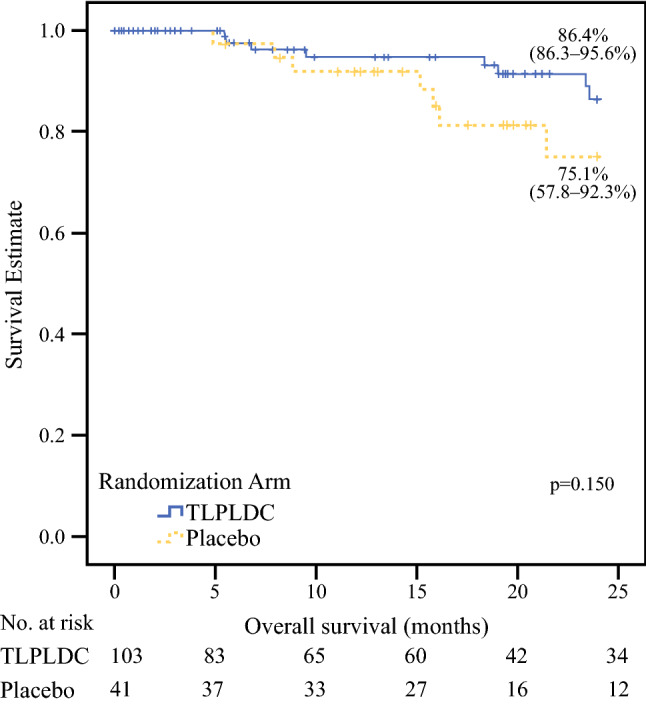
Fig. 3.

Kaplan–Meier curve demonstrating 24-month overall survival comparing TLPLDC versus placebo in the ITT analysis. A summary of the survival table is included beneath the Kaplan–Meier curve. TLPLDC tumor lysate, particle-loaded, dendritic cell, ITT intention-to-treat
